监控和管理指南
Monitoring and Management Guide
简介
Introduction
有多种工具可用于监控和检查 Celery 集群。
本文档将介绍其中的一些工具,以及与监控相关的功能,例如事件(events)和广播命令(broadcast commands)。
There are several tools available to monitor and inspect Celery clusters.
This document describes some of these, as well as features related to monitoring, like events and broadcast commands.
Workers
命令行管理实用程序(inspect/control)
Management Command-line Utilities (inspect/control)
celery 命令也可用于检查和管理 worker 节点(以及在一定程度上用于管理任务)。
若要列出所有可用的命令,请运行:
$ celery --help
或者要获取某个特定命令的帮助信息,请运行:
$ celery <command> --help
celery can also be used to inspect and manage worker nodes (and to some degree tasks).
To list all the commands available do:
$ celery --help
or to get help for a specific command do:
$ celery <command> --help
命令
Commands
shell:进入 Python 交互式 shell。
本地变量中会包含
celery变量,即当前的 app。 同时,所有已知的任务也会自动加入到本地变量中(除非设置了--without-tasks标志)。会优先使用已安装的 https://pypi.org/project/Ipython/、https://pypi.org/project/bpython/,或普通的 python。 你可以通过
--ipython、--bpython或--python强制指定某种实现。status:列出当前集群中所有存活节点
$ celery -A proj status
result:显示任务的执行结果
$ celery -A proj result -t tasks.add 4e196aa4-0141-4601-8138-7aa33db0f577
注意:如果任务未使用自定义的结果后端,则可以省略任务名。
purge:清空所有配置的任务队列中的消息。
此命令将移除
CELERY_QUEUES中配置的队列里的所有消息:警告
此操作不可撤销,消息将被永久删除!
$ celery -A proj purge
你也可以使用 -Q 选项指定要清除的队列:
$ celery -A proj purge -Q celery,foo,bar
使用 -X 选项排除某些队列不被清除:
$ celery -A proj purge -X celery
inspect active:列出所有正在执行的任务
$ celery -A proj inspect active
inspect scheduled:列出所有计划执行(ETA)的任务
$ celery -A proj inspect scheduled
这些是包含 eta 或 countdown 参数的任务,已被 worker 保留。
inspect reserved:列出所有已被 worker 预取但尚未执行的任务
$ celery -A proj inspect reserved
不包含具有 ETA 的任务。
inspect revoked:列出被撤销的任务历史记录
$ celery -A proj inspect revoked
inspect registered:列出所有已注册的任务
$ celery -A proj inspect registered
inspect stats:显示 worker 的统计信息(参考 统计信息)
$ celery -A proj inspect stats
inspect query_task:根据任务 ID 查询任务信息
任意一个拥有指定任务 ID 的 worker 将返回状态和任务信息。
$ celery -A proj inspect query_task e9f6c8f0-fec9-4ae8-a8c6-cf8c8451d4f8
你也可以一次查询多个任务:
$ celery -A proj inspect query_task id1 id2 ... idN
control enable_events:启用事件
$ celery -A proj control enable_events
control disable_events:禁用事件
$ celery -A proj control disable_events
migrate:将任务从一个 broker 迁移到另一个(实验性功能)
$ celery -A proj migrate redis://localhost amqp://localhost
该命令会将一个 broker 上的所有任务迁移到另一个。 由于该命令为实验性功能,执行前请确保备份数据!
备注
所有 inspect 和 control 命令都支持
--timeout 参数,
用于设置等待响应的时间(秒)。
如果由于网络延迟未收到响应,可以尝试增加超时时间。
shell: Drop into a Python shell.
The locals will include the
celeryvariable: this is the current app. Also all known tasks will be automatically added to locals (unless the--without-tasksflag is set).Uses https://pypi.org/project/Ipython/, https://pypi.org/project/bpython/, or regular python in that order if installed. You can force an implementation using
--ipython,--bpython, or--python.status: List active nodes in this cluster
$ celery -A proj status
result: Show the result of a task
$ celery -A proj result -t tasks.add 4e196aa4-0141-4601-8138-7aa33db0f577
Note that you can omit the name of the task as long as the task doesn't use a custom result backend.
purge: Purge messages from all configured task queues.
This command will remove all messages from queues configured in the
CELERY_QUEUESsetting:警告
There's no undo for this operation, and messages will be permanently deleted!
$ celery -A proj purge
You can also specify the queues to purge using the -Q option:
$ celery -A proj purge -Q celery,foo,bar
and exclude queues from being purged using the -X option:
$ celery -A proj purge -X celery
inspect active: List active tasks
$ celery -A proj inspect active
These are all the tasks that are currently being executed.
inspect scheduled: List scheduled ETA tasks
$ celery -A proj inspect scheduled
These are tasks reserved by the worker when they have an eta or countdown argument set.
inspect reserved: List reserved tasks
$ celery -A proj inspect reserved
This will list all tasks that have been prefetched by the worker, and is currently waiting to be executed (doesn't include tasks with an ETA value set).
inspect revoked: List history of revoked tasks
$ celery -A proj inspect revoked
inspect registered: List registered tasks
$ celery -A proj inspect registered
inspect stats: Show worker statistics (see 统计信息)
$ celery -A proj inspect stats
inspect query_task: Show information about task(s) by id.
Any worker having a task in this set of ids reserved/active will respond with status and information.
$ celery -A proj inspect query_task e9f6c8f0-fec9-4ae8-a8c6-cf8c8451d4f8
You can also query for information about multiple tasks:
$ celery -A proj inspect query_task id1 id2 ... idN
control enable_events: Enable events
$ celery -A proj control enable_events
control disable_events: Disable events
$ celery -A proj control disable_events
migrate: Migrate tasks from one broker to another (EXPERIMENTAL).
$ celery -A proj migrate redis://localhost amqp://localhost
This command will migrate all the tasks on one broker to another. As this command is new and experimental you should be sure to have a backup of the data before proceeding.
备注
All inspect and control commands supports a
--timeout argument,
This is the number of seconds to wait for responses.
You may have to increase this timeout if you're not getting a response
due to latency.
指定目标节点
Specifying destination nodes
默认情况下, inspect 和 control 命令会作用于所有 worker。
你可以通过 --destination 参数
指定一个或多个 worker:
$ celery -A proj inspect -d w1@e.com,w2@e.com reserved

$ celery -A proj control -d w1@e.com,w2@e.com enable_events
By default the inspect and control commands operates on all workers.
You can specify a single, or a list of workers by using the
--destination argument:
$ celery -A proj inspect -d w1@e.com,w2@e.com reserved

$ celery -A proj control -d w1@e.com,w2@e.com enable_events
Flower:实时 Celery web-monitor
Flower: Real-time Celery web-monitor
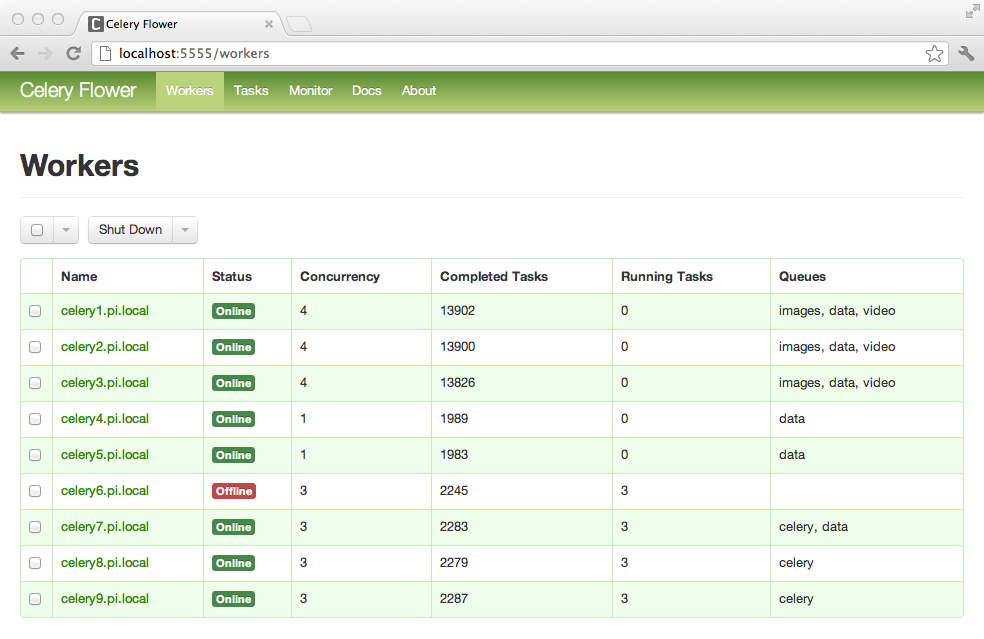
Flower 是一个基于 Web 的实时监控与管理工具,用于 Celery 集群。
它正在积极开发中,已经成为一个关键工具。
作为 Celery 官方推荐的监控工具,它取代了 Django-Admin 监控器、
celerymon 以及基于 ncurses 的监控工具。
Flower 发音类似于 "flow",当然你也可以选择植物学中的发音方式。
Flower is a real-time web based monitor and administration tool for Celery.
It's under active development, but is already an essential tool.
Being the recommended monitor for Celery, it obsoletes the Django-Admin
monitor, celerymon and the ncurses based monitor.
Flower is pronounced like "flow", but you can also use the botanical version if you prefer.
功能
Features
使用 Celery Events 进行实时监控
任务进度与历史记录
能够显示任务详情(参数、开始时间、运行时长等)
图表与统计信息
远程控制
查看 worker 状态与统计数据
关闭并重启 worker 实例
控制 worker 池大小与自动伸缩设置
查看并修改 worker 实例所消费的队列
查看当前正在运行的任务
查看计划执行的任务(ETA/countdown)
查看保留与撤销的任务
应用时间与速率限制
配置查看器
撤销或终止任务
HTTP API 接口
列出所有 workers
关闭 worker
重启 worker 池
扩展 worker 池
收缩 worker 池
自动伸缩 worker 池
开始消费某队列
停止消费某队列
列出所有任务
列出(已见)任务类型
获取任务信息
执行一个任务
通过名称执行任务
获取任务结果
修改任务的软/硬时间限制
修改任务的速率限制
撤销任务
OpenID 身份认证
截图
更多截图请见:screenshots
Real-time monitoring using Celery Events
Task progress and history
Ability to show task details (arguments, start time, run-time, and more)
Graphs and statistics
Remote Control
View worker status and statistics
Shutdown and restart worker instances
Control worker pool size and autoscale settings
View and modify the queues a worker instance consumes from
View currently running tasks
View scheduled tasks (ETA/countdown)
View reserved and revoked tasks
Apply time and rate limits
Configuration viewer
Revoke or terminate tasks
HTTP API
List workers
Shut down a worker
Restart worker’s pool
Grow worker’s pool
Shrink worker’s pool
Autoscale worker pool
Start consuming from a queue
Stop consuming from a queue
List tasks
List (seen) task types
Get a task info
Execute a task
Execute a task by name
Get a task result
Change soft and hard time limits for a task
Change rate limit for a task
Revoke a task
OpenID authentication
Screenshots
More screenshots:
用法
Usage
你可以使用 pip 安装 Flower:
$ pip install flower
运行 flower 命令将启动一个 Web 服务器,你可以通过浏览器访问它:
$ celery -A proj flower
默认端口为 http://localhost:5555,你可以使用 --port 参数修改端口:
$ celery -A proj flower --port=5555
Broker URL 也可以通过 --broker 参数传入:
$ celery --broker=amqp://guest:guest@localhost:5672// flower
或者
$ celery --broker=redis://guest:guest@localhost:6379/0 flower
然后,你可以在浏览器中访问 Flower:
$ open http://localhost:5555
Flower 的功能远不止于此,还包括身份验证等高级选项。 请查阅 官方文档 获取更多信息。
You can use pip to install Flower:
$ pip install flower
Running the flower command will start a web-server that you can visit:
$ celery -A proj flower
The default port is http://localhost:5555, but you can change this using the --port argument:
$ celery -A proj flower --port=5555
Broker URL can also be passed through the
--broker argument :
$ celery --broker=amqp://guest:guest@localhost:5672// flower
or
$ celery --broker=redis://guest:guest@localhost:6379/0 flower
Then, you can visit flower in your web browser :
$ open http://localhost:5555
Flower has many more features than are detailed here, including authorization options. Check out the official documentation for more information.
celery 事件:Curses 监控
celery events: Curses Monitor
Added in version 2.0.
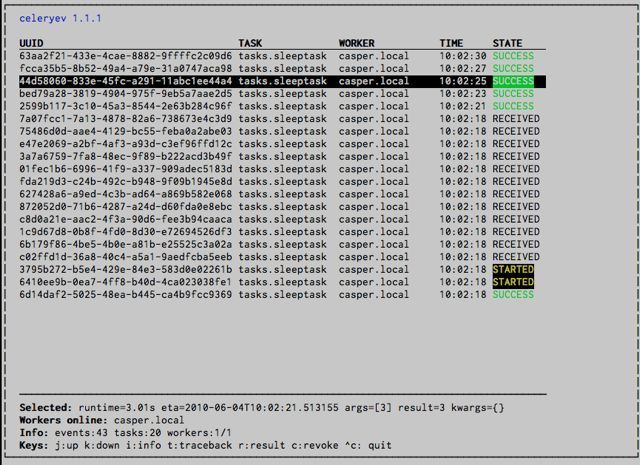
celery events 是一个基于 curses 的简易监视器,用于显示任务与 worker 的历史状态。 你可以查看任务的结果与 traceback 信息,它还支持一些管理命令,例如速率限制与关闭 worker。 该监视器最初作为概念验证工具创建,建议使用功能更强大的 Flower 替代。
启动方式如下:
$ celery -A proj events
你应该会看到如下界面:
celery events 也可用于启动快照相机(详见 快照):
$ celery -A proj events --camera=<camera-class> --frequency=1.0
并且包含一个工具可将事件输出到 stdout:
$ celery -A proj events --dump
如需查看所有可用选项,请使用 --help:
$ celery events --help
Added in version 2.0.
celery events is a simple curses monitor displaying task and worker history. You can inspect the result and traceback of tasks, and it also supports some management commands like rate limiting and shutting down workers. This monitor was started as a proof of concept, and you probably want to use Flower instead.
Starting:
$ celery -A proj events
You should see a screen like:
celery events is also used to start snapshot cameras (see 快照:
$ celery -A proj events --camera=<camera-class> --frequency=1.0
and it includes a tool to dump events to stdout:
$ celery -A proj events --dump
For a complete list of options use --help:
$ celery events --help
RabbitMQ
RabbitMQ
要管理一个 Celery 集群,了解如何监控 RabbitMQ 是非常重要的。
RabbitMQ 自带了 rabbitmqctl(1) 命令工具, 你可以使用它来列出队列、交换器、绑定关系、 队列长度、每个队列的内存使用情况, 还可以管理用户、虚拟主机及其权限。
备注
以下示例中使用的是默认虚拟主机("/"),
如果你使用了自定义虚拟主机,需为命令添加 -p 参数,例如:
rabbitmqctl list_queues -p my_vhost …
To manage a Celery cluster it is important to know how RabbitMQ can be monitored.
RabbitMQ ships with the rabbitmqctl(1) command, with this you can list queues, exchanges, bindings, queue lengths, the memory usage of each queue, as well as manage users, virtual hosts and their permissions.
备注
The default virtual host ("/") is used in these
examples, if you use a custom virtual host you have to add
the -p argument to the command, for example:
rabbitmqctl list_queues -p my_vhost …
检查队列
Inspecting queues
查询队列中的任务数量:
$ rabbitmqctl list_queues name messages messages_ready \
                        messages_unacknowledged
其中,messages_ready 表示已发送但尚未被接收的消息数量, messages_unacknowledged 表示已被 worker 接收但尚未确认的消息数量 (表示该任务正在执行或已被保留)。 messages 则是上述两者之和。
查询当前从某个队列中消费的 worker 数量:
$ rabbitmqctl list_queues name consumers
查询分配给某个队列的内存量:
$ rabbitmqctl list_queues name memory
- Tip:
给 rabbitmqctl(1) 添加
-q选项可以使输出更易于解析。
Finding the number of tasks in a queue:
$ rabbitmqctl list_queues name messages messages_ready \
                        messages_unacknowledged
Here messages_ready is the number of messages ready for delivery (sent but not received), messages_unacknowledged is the number of messages that's been received by a worker but not acknowledged yet (meaning it is in progress, or has been reserved). messages is the sum of ready and unacknowledged messages.
Finding the number of workers currently consuming from a queue:
$ rabbitmqctl list_queues name consumers
Finding the amount of memory allocated to a queue:
$ rabbitmqctl list_queues name memory
- Tip:
Adding the
-qoption to rabbitmqctl(1) makes the output easier to parse.
Redis
Redis
如果你使用 Redis 作为 broker,可以使用 redis-cli(1) 命令来监控 Celery 集群中各队列的长度。
If you're using Redis as the broker, you can monitor the Celery cluster using the redis-cli(1) command to list lengths of queues.
检查队列
Inspecting queues
查询队列中的任务数量:
$ redis-cli -h HOST -p PORT -n DATABASE_NUMBER llen QUEUE_NAME
默认的队列名为 celery。要获取所有可用的队列,可以使用:
$ redis-cli -h HOST -p PORT -n DATABASE_NUMBER keys \*
备注
队列的键只有在其中存在任务时才会存在。 如果某个键不存在,仅表示该队列中当前没有消息。 因为在 Redis 中,如果列表为空会自动被删除, 所以该键不会出现在 keys 命令的输出中, 对该键使用 llen 命令也会返回 0。
另外,如果你还在使用 Redis 执行其他任务, keys 命令的输出可能会包含数据库中不相关的键值。 推荐的做法是为 Celery 使用一个专用的 DATABASE_NUMBER, 你也可以用不同的数据库编号来隔离不同的 Celery 应用(相当于虚拟主机), 但需要注意,这不会影响像 Flower 这样基于 Redis 的 pub/sub 事件监控, 因为 pub/sub 是全局性的,而非按数据库划分的。
Finding the number of tasks in a queue:
$ redis-cli -h HOST -p PORT -n DATABASE_NUMBER llen QUEUE_NAME
The default queue is named celery. To get all available queues, invoke:
$ redis-cli -h HOST -p PORT -n DATABASE_NUMBER keys \*
备注
Queue keys only exists when there are tasks in them, so if a key doesn't exist it simply means there are no messages in that queue. This is because in Redis a list with no elements in it is automatically removed, and hence it won't show up in the keys command output, and llen for that list returns 0.
Also, if you're using Redis for other purposes, the output of the keys command will include unrelated values stored in the database. The recommended way around this is to use a dedicated DATABASE_NUMBER for Celery, you can also use database numbers to separate Celery applications from each other (virtual hosts), but this won't affect the monitoring events used by for example Flower as Redis pub/sub commands are global rather than database based.
Munin
Munin
以下是一些在维护 Celery 集群时可能有用的已知 Munin 插件列表:
rabbitmq-munin:用于 RabbitMQ 的 Munin 插件。celery_tasks:监控每种任务类型的执行次数(需要 celerymon 支持)。https://github.com/munin-monitoring/contrib/blob/master/plugins/celery/celery_tasks
celery_tasks_states:监控各个状态下的任务数量(需要 celerymon 支持)。https://github.com/munin-monitoring/contrib/blob/master/plugins/celery/celery_tasks_states
This is a list of known Munin plug-ins that can be useful when maintaining a Celery cluster.
rabbitmq-munin: Munin plug-ins for RabbitMQ.celery_tasks: Monitors the number of times each task type has been executed (requires celerymon).https://github.com/munin-monitoring/contrib/blob/master/plugins/celery/celery_tasks
celery_tasks_states: Monitors the number of tasks in each state (requires celerymon).https://github.com/munin-monitoring/contrib/blob/master/plugins/celery/celery_tasks_states
事件
Events
Worker 有能力在某些事件发生时发送消息。这些事件可以被如 Flower 和 celery events 等工具捕获,用于监控集群状态。
The worker has the ability to send a message whenever some event happens. These events are then captured by tools like Flower, and celery events to monitor the cluster.
快照
Snapshots
Added in version 2.1.
即使是单个 worker 也可能产生大量事件,因此将所有事件的历史记录存储到磁盘上 可能非常昂贵。
一系列事件描述了该时间段内的集群状态, 通过定期对这一状态进行快照,可以保留整个历史记录, 但只需周期性地写入磁盘。
若要拍摄快照,你需要定义一个 Camera 类,它决定了每次捕获状态时应执行的操作; 你可以选择将其写入数据库、发送邮件,或者采取其他任意处理方式。
celery events 可用于结合 camera 来拍摄快照,
例如,若你希望每隔 2 秒捕获一次状态,且使用 camera 类 myapp.Camera,
你可以使用如下命令运行 celery events:
$ celery -A proj events -c myapp.Camera --frequency=2.0
Added in version 2.1.
Even a single worker can produce a huge amount of events, so storing the history of all events on disk may be very expensive.
A sequence of events describes the cluster state in that time period, by taking periodic snapshots of this state you can keep all history, but still only periodically write it to disk.
To take snapshots you need a Camera class, with this you can define what should happen every time the state is captured; You can write it to a database, send it by email or something else entirely.
celery events is then used to take snapshots with the camera,
for example if you want to capture state every 2 seconds using the
camera myapp.Camera you run celery events with the following
arguments:
$ celery -A proj events -c myapp.Camera --frequency=2.0
自定义摄像头
Custom Camera
如果你需要周期性地捕获事件并进行处理,Camera 会很有用。
若需实时处理事件,应该直接使用 app.events.Receiver,详见
实时处理。
以下是一个示例 camera,它将快照信息打印到屏幕上:
from pprint import pformat

from celery.events.snapshot import Polaroid

class DumpCam(Polaroid):
    clear_after = True  # flush 后清除状态(包括 state.event_count)

    def on_shutter(self, state):
        if not state.event_count:
            # 自上次快照后无新事件
            return
        print('Workers: {0}'.format(pformat(state.workers, indent=4)))
        print('Tasks: {0}'.format(pformat(state.tasks, indent=4)))
        print('Total: {0.event_count} events, {0.task_count} tasks'.format(
            state))
详见 celery.events.state 的 API 参考,了解更多关于 state 对象的信息。
你可以通过在运行 celery events 时使用 -c 选项来指定使用该 camera:
$ celery -A proj events -c myapp.DumpCam --frequency=2.0
你也可以以编程方式使用该 camera,如下所示:
from celery import Celery
from myapp import DumpCam

def main(app, freq=1.0):
    state = app.events.State()
    with app.connection() as connection:
        recv = app.events.Receiver(connection, handlers={'*': state.event})
        with DumpCam(state, freq=freq):
            recv.capture(limit=None, timeout=None)

if __name__ == '__main__':
    app = Celery(broker='amqp://guest@localhost//')
    main(app)
Cameras can be useful if you need to capture events and do something
with those events at an interval. For real-time event processing
you should use app.events.Receiver directly, like in
实时处理.
Here is an example camera, dumping the snapshot to screen:
from pprint import pformat

from celery.events.snapshot import Polaroid

class DumpCam(Polaroid):
    clear_after = True  # clear after flush (incl, state.event_count).

    def on_shutter(self, state):
        if not state.event_count:
            # No new events since last snapshot.
            return
        print('Workers: {0}'.format(pformat(state.workers, indent=4)))
        print('Tasks: {0}'.format(pformat(state.tasks, indent=4)))
        print('Total: {0.event_count} events, {0.task_count} tasks'.format(
            state))
See the API reference for celery.events.state to read more
about state objects.
Now you can use this cam with celery events by specifying
it with the -c option:
$ celery -A proj events -c myapp.DumpCam --frequency=2.0
Or you can use it programmatically like this:
from celery import Celery
from myapp import DumpCam

def main(app, freq=1.0):
    state = app.events.State()
    with app.connection() as connection:
        recv = app.events.Receiver(connection, handlers={'*': state.event})
        with DumpCam(state, freq=freq):
            recv.capture(limit=None, timeout=None)

if __name__ == '__main__':
    app = Celery(broker='amqp://guest@localhost//')
    main(app)
实时处理
Real-time processing
若要实时处理事件,需要以下组件:
一个事件消费者(即
Receiver)一组事件处理器,会在事件到达时被调用。
你可以为每种事件类型定义不同的处理器, 也可以使用通配处理器(如 '*')
状态(可选)
app.events.State是一个内存中的便捷结构,用于表示 集群中的任务和 worker,会在事件到达时自动更新。它封装了解决许多常见需求的方法,例如判断某个 worker 是否存活 (通过检查心跳)、将事件字段合并、确保时间戳同步等等。
结合这些组件,你就可以轻松实现事件的实时处理:
from celery import Celery


def my_monitor(app):
    state = app.events.State()

    def announce_failed_tasks(event):
        state.event(event)
        # 任务名仅在 -received 事件中传送,state 会帮我们记录
        task = state.tasks.get(event['uuid'])

        print('TASK FAILED: %s[%s] %s' % (
            task.name, task.uuid, task.info(),))

    with app.connection() as connection:
        recv = app.events.Receiver(connection, handlers={
                'task-failed': announce_failed_tasks,
                '*': state.event,
        })
        recv.capture(limit=None, timeout=None, wakeup=True)

if __name__ == '__main__':
    app = Celery(broker='amqp://guest@localhost//')
    my_monitor(app)
备注
向 capture 传入 wakeup 参数会向所有 worker 发送一个信号,
强制其发送心跳。这样一来,当监控器启动时就能立刻看到所有 worker。
你也可以通过只注册感兴趣的处理器来监听特定事件:
from celery import Celery

def my_monitor(app):
    state = app.events.State()

    def announce_failed_tasks(event):
        state.event(event)
        # 任务名仅在 -received 事件中传送,state 会帮我们记录
        task = state.tasks.get(event['uuid'])

        print('TASK FAILED: %s[%s] %s' % (
            task.name, task.uuid, task.info(),))

    with app.connection() as connection:
        recv = app.events.Receiver(connection, handlers={
                'task-failed': announce_failed_tasks,
        })
        recv.capture(limit=None, timeout=None, wakeup=True)

if __name__ == '__main__':
    app = Celery(broker='amqp://guest@localhost//')
    my_monitor(app)
To process events in real-time you need the following
An event consumer (this is the
Receiver)A set of handlers called when events come in.
You can have different handlers for each event type, or a catch-all handler can be used ('*')
State (optional)
app.events.Stateis a convenient in-memory representation of tasks and workers in the cluster that's updated as events come in.It encapsulates solutions for many common things, like checking if a worker is still alive (by verifying heartbeats), merging event fields together as events come in, making sure time-stamps are in sync, and so on.
Combining these you can easily process events in real-time:
from celery import Celery


def my_monitor(app):
    state = app.events.State()

    def announce_failed_tasks(event):
        state.event(event)
        # task name is sent only with -received event, and state
        # will keep track of this for us.
        task = state.tasks.get(event['uuid'])

        print('TASK FAILED: %s[%s] %s' % (
            task.name, task.uuid, task.info(),))

    with app.connection() as connection:
        recv = app.events.Receiver(connection, handlers={
                'task-failed': announce_failed_tasks,
                '*': state.event,
        })
        recv.capture(limit=None, timeout=None, wakeup=True)

if __name__ == '__main__':
    app = Celery(broker='amqp://guest@localhost//')
    my_monitor(app)
备注
The wakeup argument to capture sends a signal to all workers
to force them to send a heartbeat. This way you can immediately see
workers when the monitor starts.
You can listen to specific events by specifying the handlers:
from celery import Celery

def my_monitor(app):
    state = app.events.State()

    def announce_failed_tasks(event):
        state.event(event)
        # task name is sent only with -received event, and state
        # will keep track of this for us.
        task = state.tasks.get(event['uuid'])

        print('TASK FAILED: %s[%s] %s' % (
            task.name, task.uuid, task.info(),))

    with app.connection() as connection:
        recv = app.events.Receiver(connection, handlers={
                'task-failed': announce_failed_tasks,
        })
        recv.capture(limit=None, timeout=None, wakeup=True)

if __name__ == '__main__':
    app = Celery(broker='amqp://guest@localhost//')
    my_monitor(app)
事件参考
Event Reference
以下列表包含了由 worker 发送的事件及其参数。
This list contains the events sent by the worker, and their arguments.
任务事件
Task Events
任务已发送
task-sent
- signature:
task-sent(uuid, name, args, kwargs, retries, eta, expires,
queue, exchange, routing_key, root_id, parent_id)
当任务消息被发布,且已启用 task_send_sent_event 设置时发送。
- signature:
task-sent(uuid, name, args, kwargs, retries, eta, expires, queue, exchange, routing_key, root_id, parent_id)
Sent when a task message is published and
the task_send_sent_event setting is enabled.
任务已接收
task-received
- signature:
task-received(uuid, name, args, kwargs, retries, eta, hostname,
timestamp, root_id, parent_id)
当 worker 接收到任务时发送。
- signature:
task-received(uuid, name, args, kwargs, retries, eta, hostname,
timestamp, root_id, parent_id)
Sent when the worker receives a task.
任务已启动
task-started
- signature:
task-started(uuid, hostname, timestamp, pid)
在 worker 即将执行任务前发送。
- signature:
task-started(uuid, hostname, timestamp, pid)
Sent just before the worker executes the task.
任务已成功
task-succeeded
- signature:
task-succeeded(uuid, result, runtime, hostname, timestamp)
当任务成功执行时发送。
运行时间(runtime)是指任务通过池(pool)执行所耗费的时间。 (从任务被发送到 worker 池开始,到池的结果处理回调被调用为止)。
- signature:
task-succeeded(uuid, result, runtime, hostname, timestamp)
Sent if the task executed successfully.
Run-time is the time it took to execute the task using the pool. (Starting from the task is sent to the worker pool, and ending when the pool result handler callback is called).
任务已失败
task-failed
- signature:
task-failed(uuid, exception, traceback, hostname, timestamp)
当任务执行失败时发送。
- signature:
task-failed(uuid, exception, traceback, hostname, timestamp)
Sent if the execution of the task failed.
任务已拒绝
task-rejected
- signature:
task-rejected(uuid, requeue)
任务被 worker 拒绝处理,可能被重新入队或转移至死信队列。
- signature:
task-rejected(uuid, requeue)
The task was rejected by the worker, possibly to be re-queued or moved to a dead letter queue.
任务已撤销
task-revoked
- signature:
task-revoked(uuid, terminated, signum, expired)
当任务被撤销时发送(注意:该事件可能由多个 worker 发送)。
如果任务进程被终止,则
terminated为 true,且signum字段表示使用的信号。如果任务已过期,则
expired为 true。
- signature:
task-revoked(uuid, terminated, signum, expired)
Sent if the task has been revoked (Note that this is likely to be sent by more than one worker).
terminatedis set to true if the task process was terminated, and thesignumfield set to the signal used.expiredis set to true if the task expired.
任务已重试
task-retried
- signature:
task-retried(uuid, exception, traceback, hostname, timestamp)
当任务失败但将会在未来被重试时发送。
- signature:
task-retried(uuid, exception, traceback, hostname, timestamp)
Sent if the task failed, but will be retried in the future.
Worker 事件
Worker Events
worker-online
worker-online
- signature:
worker-online(hostname, timestamp, freq, sw_ident, sw_ver, sw_sys)
worker 已连接至 broker 并处于在线状态。
hostname:worker 的节点名称。
timestamp:事件时间戳。
freq:心跳频率(单位:秒,浮点数)。
sw_ident:worker 软件名称(例如
py-celery)。sw_ver:软件版本(例如 2.2.0)。
sw_sys:操作系统(例如 Linux 或 Darwin)。
- signature:
worker-online(hostname, timestamp, freq, sw_ident, sw_ver, sw_sys)
The worker has connected to the broker and is online.
hostname: Nodename of the worker.
timestamp: Event time-stamp.
freq: Heartbeat frequency in seconds (float).
sw_ident: Name of worker software (e.g.,
py-celery).sw_ver: Software version (e.g., 2.2.0).
sw_sys: Operating System (e.g., Linux/Darwin).
worker-heartbeat
worker-heartbeat
- signature:
worker-heartbeat(hostname, timestamp, freq, sw_ident, sw_ver, sw_sys,
active, processed)
每分钟发送一次,如果 2 分钟内未收到心跳,则视为离线。
hostname:worker 的节点名称。
timestamp:事件时间戳。
freq:心跳频率(单位:秒,浮点数)。
sw_ident:worker 软件名称(例如
py-celery)。sw_ver:软件版本(例如 2.2.0)。
sw_sys:操作系统(例如 Linux 或 Darwin)。
active:当前正在执行的任务数量。
processed:该 worker 已处理的任务总数。
- signature:
worker-heartbeat(hostname, timestamp, freq, sw_ident, sw_ver, sw_sys,
active, processed)
Sent every minute, if the worker hasn't sent a heartbeat in 2 minutes, it is considered to be offline.
hostname: Nodename of the worker.
timestamp: Event time-stamp.
freq: Heartbeat frequency in seconds (float).
sw_ident: Name of worker software (e.g.,
py-celery).sw_ver: Software version (e.g., 2.2.0).
sw_sys: Operating System (e.g., Linux/Darwin).
active: Number of currently executing tasks.
processed: Total number of tasks processed by this worker.
worker-offline
worker-offline
- signature:
worker-offline(hostname, timestamp, freq, sw_ident, sw_ver, sw_sys)
worker 已从 broker 断开连接。
- signature:
worker-offline(hostname, timestamp, freq, sw_ident, sw_ver, sw_sys)
The worker has disconnected from the broker.