应用程序审查和改进#
Application review and improvements
在这个阶段,我们已经完成了DISTAL系统的实现,并且它按预期工作:用户可以选择一个国家,输入一个以英里为单位的搜索半径,点击一个起始点,然后查看一张显示所有位于所选搜索半径内的地点名称的高分辨率地图。我们已经解决了距离问题,并且拥有了搜索全球任何地方名称所需的所有数据。
当然,我们还没有完成。我们的DISTAL应用程序在以下几个方面仍然存在一些问题:
可用性
质量
性能
让我们来看看这些问题,并探讨如何改进DISTAL系统的设计和实现。
At this stage, we have a complete implementation of the DISTAL system that works as advertised: a user can choose a country, enter a search radius in miles, click on a starting point, and see a high-resolution map showing all the place names within the desired search radius. We have solved the distance problem, and have all the data needed to search for place names anywhere in the world.
Of course, we aren’t finished yet. There are several areas where our DISTAL application doesn’t work as it should, including the following:
Usability
Quality
Performance
Let’s take a look at each of these issues, and see how we could improve our design and implementation of the DISTAL system.
可用性#
Usability
如果你探索DISTAL应用程序,你很快会发现某些国家存在一个主要的可用性问题。例如,如果你点击 美国 (United States)在 选择国家 页面上,你将看到以下地图来点击:
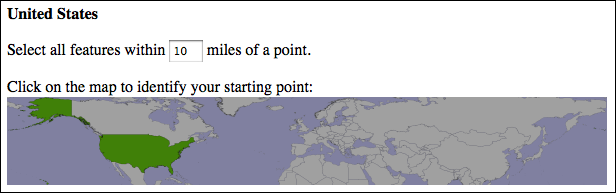
使用这张地图准确点击一个所需的点几乎是不可能的。
问题出在哪里呢?问题在于两个方面:
美国的轮廓不仅包括了美国本土,还包括了偏远的阿拉斯加和夏威夷州。这大大增加了地图的大小。
阿拉斯加跨越了180度经线——阿拉斯加半岛超出了180度西,经由阿留申群岛一直延伸到阿图岛,后者的经度为172度东。由于跨越了180度经线,阿拉斯加出现在世界地图的左右两侧。
因此,美国的地图从-180度到+180度经度,以及+18度到+72度纬度。这张地图大到几乎无法使用。
即使是那些没有被分割成独立的偏远州,且不跨越180度经线的国家,我们也不能确保这些地图足够详细,能让用户准确点击。例如,这里是 加拿大 (Canada)的地图:
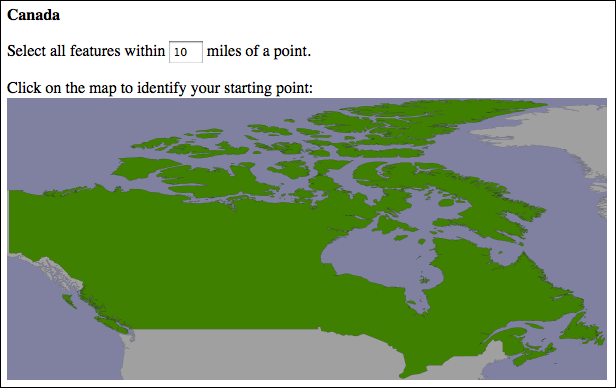
由于加拿大宽度超过3,000英里,准确地通过点击地图上的一个点来选择10英里的搜索半径将是令人沮丧的体验。
一个显而易见的解决方案是,让用户在点击选择搜索起始点之前,可以先在大比例地图上“放大”所需的区域。因此,对于这些较大的国家,用户可以先选择国家,选择要搜索的部分,然后再点击所需的起始点。
但这并不能解决180度经线的问题,这个问题相对复杂。理想情况下,你需要识别那些跨越180度经线的国家,并将它们重新投影到另一个坐标系统中,使得它们的多边形能够连续绘制。
If you explore the DISTAL application, you will soon discover a major usability problem with some of the countries. For example, if you click on the United States in the Select Country page, you will be presented with the following map to click on:
Accurately clicking on a desired point using this map would be almost impossible.
What has gone wrong? The problem here is twofold:
The United States outline doesn’t just cover the mainland US, but also includes the outlying states of Alaska and Hawaii. This increases the size of the map considerably.
Alaska crosses the 180th meridian—the Alaska Peninsula extends beyond 180 degree west, and continues across the Aleutian Islands to finish at Attu Island with a longitude of 172 degree east. Because it crosses the 180th meridian, Alaska appears on both the left and right sides of the world map.
Because of this, the United States map goes from -180 degree to +180 degree longitude and +18 degree to +72 degree latitude. This map is far too big to be usable.
Even for countries which aren’t split into separate outlying states, and which don’t cross the 180th meridian, we can’t be assured that the maps will be detailed enough to click on accurately. For example, here is the map for Canada:
Because Canada is over 3,000 miles wide, accurately selecting a 10-mile search radius by clicking on a point on this map would be an exercise in frustration.
An obvious solution to these usability issues would be to let the user “zoom in” on a desired area of the large-scale map before clicking to select the starting point for the search. Thus, for these larger countries, the user would select the country, choose which portion of the country to search on, and then click on the desired starting point.
This doesn’t solve the 180th meridian problem, which is somewhat more difficult. Ideally, you would identify those countries which cross the 180th meridian and reproject them into some other coordinate system that allows their polygons to be drawn contiguously.
质量#
Quality
在使用DISTAL系统时,你很快会注意到一些与所使用的基础数据相关的质量问题。我们将考虑两个这样的问提:名称数据的问题,以及地点名称的经纬度坐标问题。
As you use the DISTAL system, you will quickly notice some quality issues related to the underlying data that is being used. We are going to consider two such issues: problems with the name data, and problems with the place name lat/long coordinates.
地名问题#
Place name issues
如果你查看地点名称列表,你会注意到一些名称周围有双括号,如下所示:
…
(( Shinavlash ))
(( Pilur ))
(( Kaçarat ))
(( Kaçaj ))
(( Goricë ))
(( Lilaj ))
…
这些是被认为不再存在的地方的名称。此外,你还会注意到一些名称中包含了“historical”一词,并被方括号或圆括号包围:
…
Fairbank (historical)
Kopiljača [historical]
Hardyville (historical)
Dorčol (historical)
Sotos Crossing (historical)
Dušanovac (historical)
…
显然,这些也应该被删除。过滤掉应该从DISTAL数据库中排除的名称是相对简单的,可以在我们将NationalFile和Geonames文件导入数据库时将其添加到导入逻辑中。
If you look through the list of place names, you’ll notice that some of the names have double parentheses around them, like this:
…
(( Shinavlash ))
(( Pilur ))
(( Kaçarat ))
(( Kaçaj ))
(( Goricë ))
(( Lilaj ))
…
These are names for places which are thought to no longer exist. Also, you will notice that some names have the word “historical” in them, surrounded by either square brackets or parentheses:
…
Fairbank (historical)
Kopiljača [historical]
Hardyville (historical)
Dorčol (historical)
Sotos Crossing (historical)
Dušanovac (historical)
…
Obviously, these should also be removed. Filtering out the names, which should be excluded from the DISTAL database is relatively straightforward, and could be added to our import logic as we read the NationalFile and Geonames files into the database.
纬度/经度坐标问题#
Lat/Long coordinate problems
考虑以下覆盖荷兰一部分的DISTAL地图:
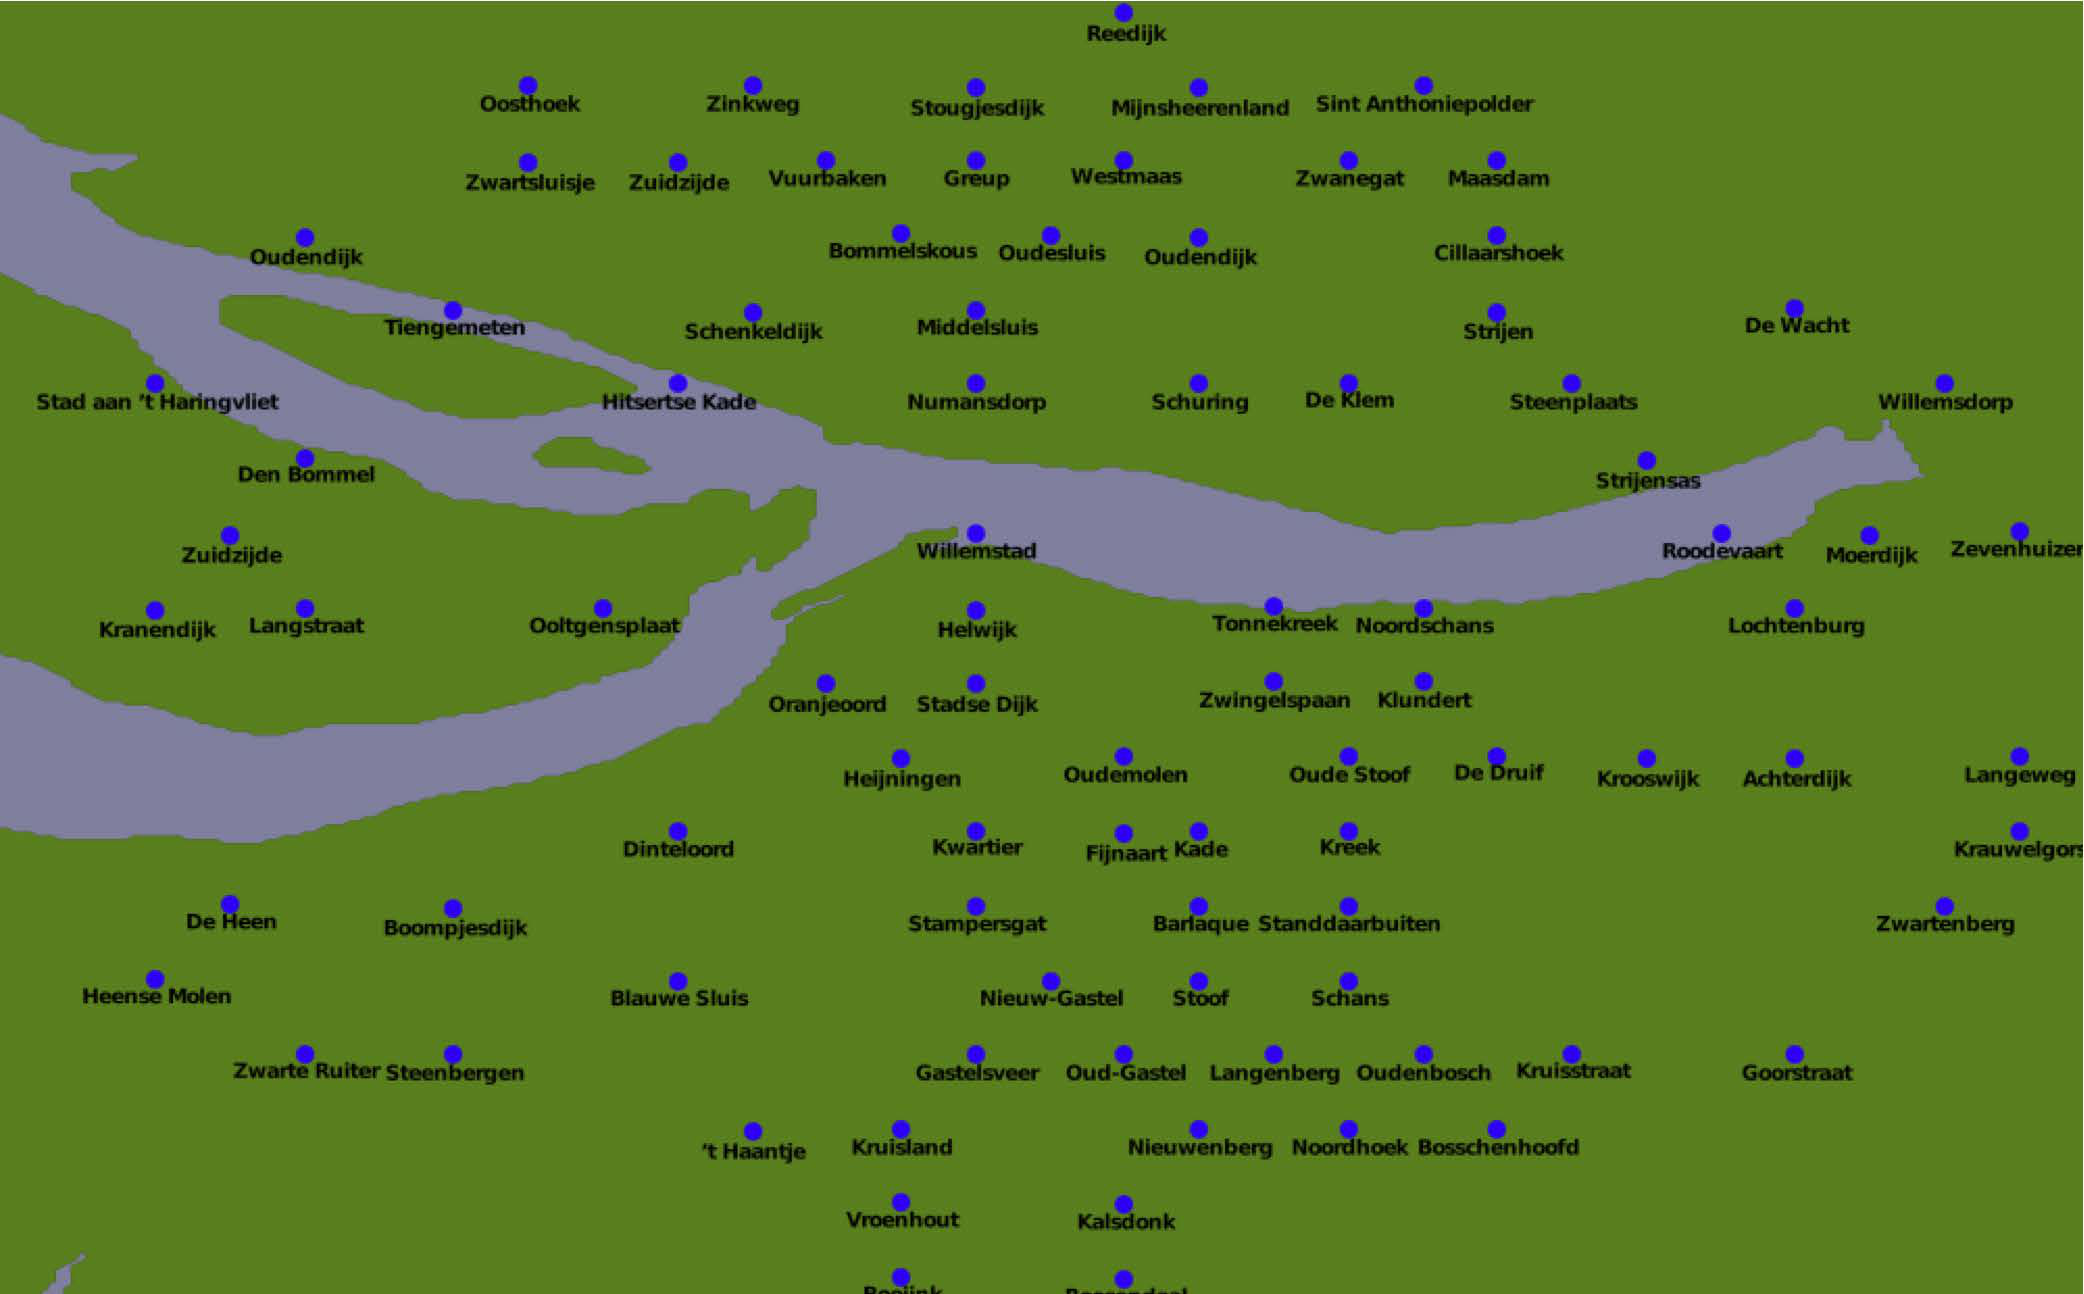
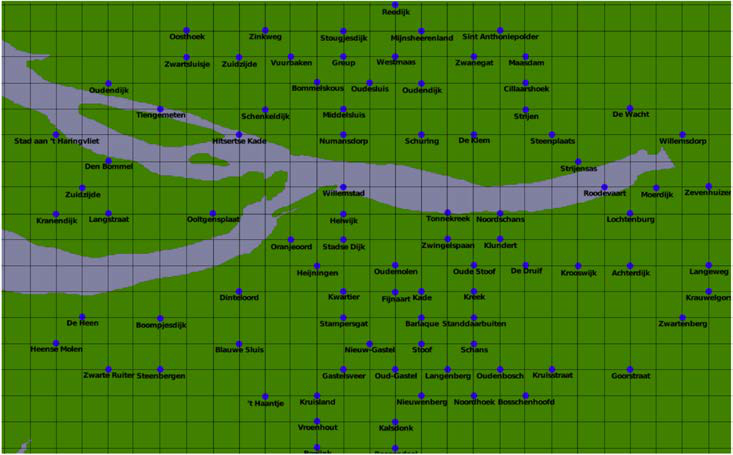
城市的布局看起来异常规则,仿佛城市被整齐地排列成行和列。用网格覆盖这张地图证实了这种怀疑:
当然,城镇和城市本身并不像这样规律地分布——问题似乎是由于国际地点名称数据中经度和纬度坐标的不准确四舍五入造成的。
这不会影响DISTAL应用程序的运行,但用户可能会对当地点名称如此规律地绘制在地图上时,对结果的质量产生怀疑。解决这个问题的唯一方法是找到一个更准确的国际地点名称坐标数据来源。
Consider the following DISTAL map, covering a part of Netherlands:
The placement of the cities look suspiciously regular, as if the cities are neatly stacked into rows and columns. Drawing a grid over this map confirms this suspicion:
The towns and cities themselves aren’t as regularly spaced as this, of course—the problem appears to be caused by inaccurately rounded lat/long coordinates within the international place name data.
This doesn’t affect the operation of the DISTAL application, but users may be suspicious about the quality of the results when the place names are drawn so regularly onto the map. The only solution to this problem would be to find a source of more accurate coordinate data for international place names.
性能#
Performance
我们的DISTAL应用程序肯定在运行,但它的性能还有待提高。虽然`selectCountry.py`和`selectArea.py`脚本运行得很快,但`showResults.py`的执行可能需要长达三秒钟。这显然还不够好:这样的延迟对用户来说是令人烦恼的,一旦服务器每分钟收到超过二十个请求,它就会处理不过来,造成灾难性的后果。
Our DISTAL application is certainly working, but its performance leaves something to be desired. While the selectCountry.py and selectArea.py scripts run quickly, it can take up to three seconds for showResults.py to complete. Clearly, this isn’t good enough: a delay like this is annoying to the user, and would be disastrous for the server as soon as it receives more than twenty requests per minute, as it would be receiving more requests than it could process.
查找问题#
Finding the problem
让我们来看看这里发生了什么。我们可以很容易地在`showResults.py`中添加一些基本的计时代码,如下所示:
import time
import logging
logger = logging.getLogger(...)

start_time = time.time()
...
end_time = time.time()
logger.debug("Operation took %0.4f seconds" % (end_time - start_time))
备注
注意,这里使用了Python的标准模块`logging`来保存计时结果。由于CGI脚本使用stdout进行HTML输出,我们不能使用`print`语句来打印结果。如果你想为自己的代码添加计时功能,确保首先配置好日志记录器(例如,使用`logging.FileHandler`)。
运行这段代码后,可以看到脚本大部分时间花费的地方:
计算经纬度坐标花费了0.0110秒
确定地点名称花费了0.0088秒
生成地图花费了3.0208秒
构建HTML页面花费了0.0000秒
显然,生成地图的过程是瓶颈。由于在`selectArea.py`脚本中生成地图只花费了不到一秒钟,因此地图生成过程本身并没有导致这个瓶颈。那么,是什么变化导致了这种情况呢?
可能是显示地点名称花费了时间,但这不太可能。更可能的原因是我们显示的地图数据量太大: showResults.py 脚本使用了来自GSHHS数据集的高分辨率海岸线轮廓,而不是来自世界边界数据集的低分辨率国家轮廓。为了验证这个理论,我们可以将生成地图时使用的数据改为低分辨率的国家表,而不是高分辨率的海岸线表。
结果是,速度有了显著提高:
生成地图花费了0.1729秒
那么,我们如何使 showResults.py 中的地图生成更快呢?答案在于海岸线数据的性质以及我们如何使用它。考虑一下在法国勒阿弗尔周围10英里内查找地点的情况:
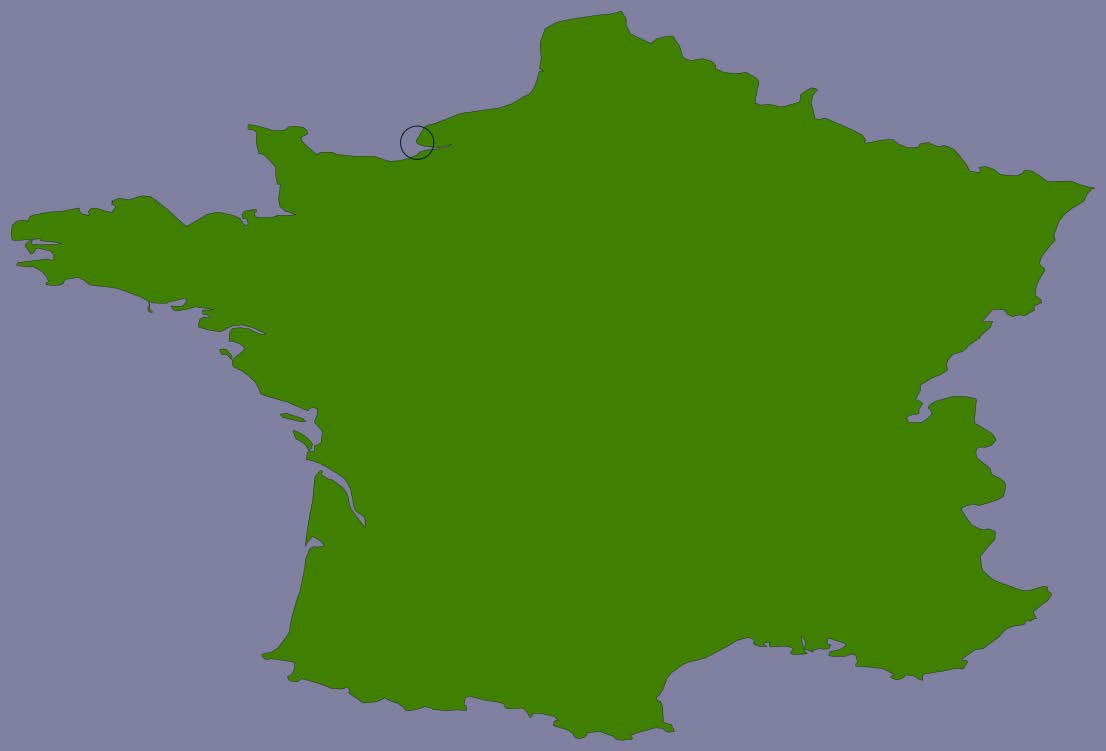
高分辨率的海岸线图像会是这样的:
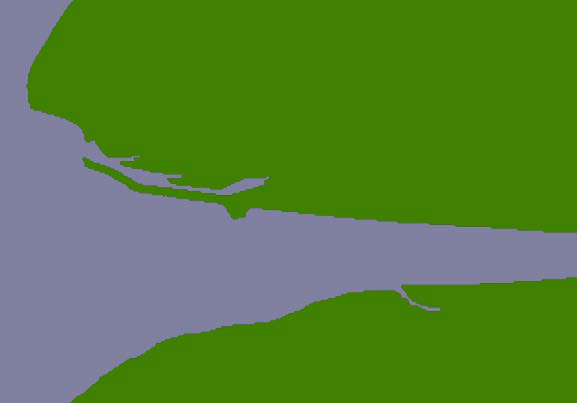
但是这段海岸线实际上属于以下GSHHS海岸线特征的一部分:
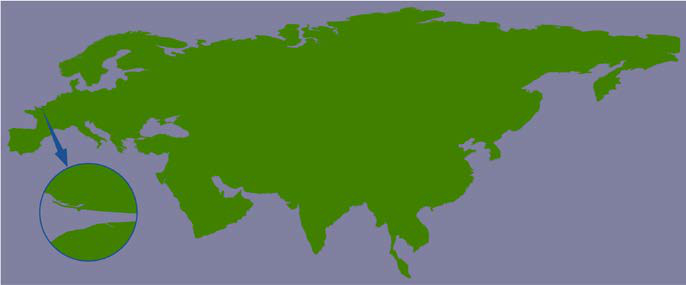
这个海岸线多边形非常庞大,包含超过110万个点,而我们实际上只显示了其中的一小部分。
由于这些海岸线多边形非常大,地图生成器需要读取整个巨大的多边形,然后丢弃99%的数据,才能获得所需的海岸线部分。而且,由于多边形的边界框非常大,许多无关的多边形在生成地图时被处理(然后过滤掉)。这就是为什么`showResults.py`执行得这么慢的原因。
Let’s take a look at what is going on here. It’s easy to add some basic timing code to showResults.py, like this:
import time
import logging
logger = logging.getLogger(...)

start_time = time.time()
...
end_time = time.time()
logger.debug("Operation took %0.4f seconds" % (end_time – start_time)
备注
Note that this uses the logging Python standard module to save the timing results. Because CGI scripts use stdout for the HTML output, we can’t use the print statement to print out the results. If you want to time your own code, make sure you configure your logger (for example, to use a logging.FileHandler) first.
Running this code reveals where the script is taking most of its time:
Calculating lat/long coordinate took 0.0110 seconds
Identifying place names took 0.0088 seconds
Generating map took 3.0208 seconds
Building HTML page took 0.0000 seconds
Clearly the map-generation process is the bottleneck here. Since it only took a fraction of a second to generate a map within the selectArea.py script, there’s nothing inherent in the map-generation process that causes this bottleneck. So what has changed?
It could be that displaying the place names takes a while, but that’s unlikely. It’s far more likely to be caused by the amount of map data that we are displaying: the showResults.py script is using high-resolution shoreline outlines taken from the GSHHS dataset, rather than the low-resolution country outline taken from the World Borders Dataset. To test this theory, we can change the map data being used to generate the map, altering showResults.py to use the low-resolution countries table instead of the high-resolution shorelines table.
The result is a dramatic improvement in speed:
Generating map took 0.1729 seconds
So how can we make the map generation in showResults.py faster? The answer lies in the nature of the shoreline data and how we are using it. Consider the situation where you are identifying points within 10 miles of Le Havre in France:
The high-resolution shoreline image would look like this:
But this section of coastline is actually part of the following GSHHS shoreline feature:
This shoreline polygon is enormous, consisting of over 1.1 million points, and we’re only displaying a very small part of it.
Because these shoreline polygons are so big, the map generator needs to read in the entire huge polygon and then discard 99 percent of it to get the desired section of shoreline. Also, because the polygon bounding boxes are so large, many irrelevant polygons are being processed (and then filtered out) when generating the map. This is why showResults.py is so slow.
提高性能#
Improving performance
当然,改善 showResults.py 脚本的性能是完全可能的。正如我们在前一章的最佳实践部分中提到的,空间索引在处理相对较小的几何图形时效果最佳——然而,我们的海岸线多边形可远不算小。不过,由于DISTAL应用只显示一定距离范围内的地点,我们可以将这些巨大的多边形分割成“瓦片”,然后在数据库中预先计算并存储它们。
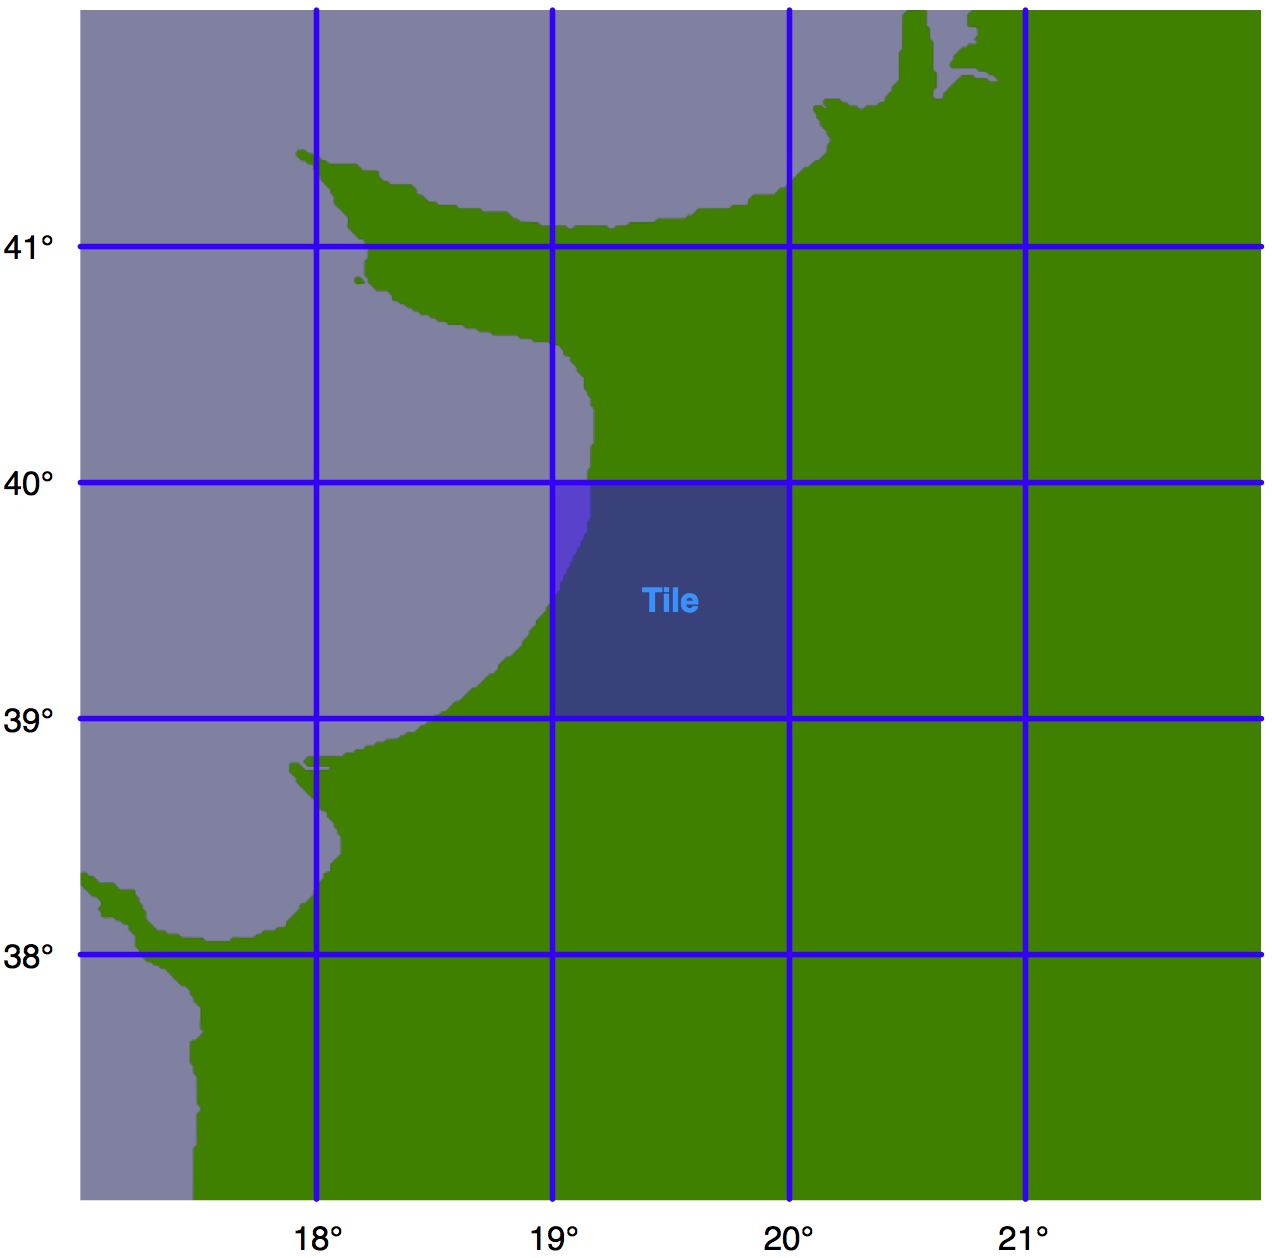
假设我们设置搜索半径为100英里。我们还任意定义瓦片的大小为1度的纬度高和1度的经度宽:
备注
注意,我们可以选择任何瓦片大小,但选择整度的经纬度是为了便于计算给定经纬度坐标位于哪个瓦片内。每个瓦片将分配一个整数纬度和经度值,我们称之为iLat和iLong。然后,我们可以通过以下方式计算给定经纬度所在的瓦片:
iLat = int(round(latitude))
iLong = int(round(longitude))
然后我们可以简单地查找具有给定 iLat 和 iLong 值的瓦片。
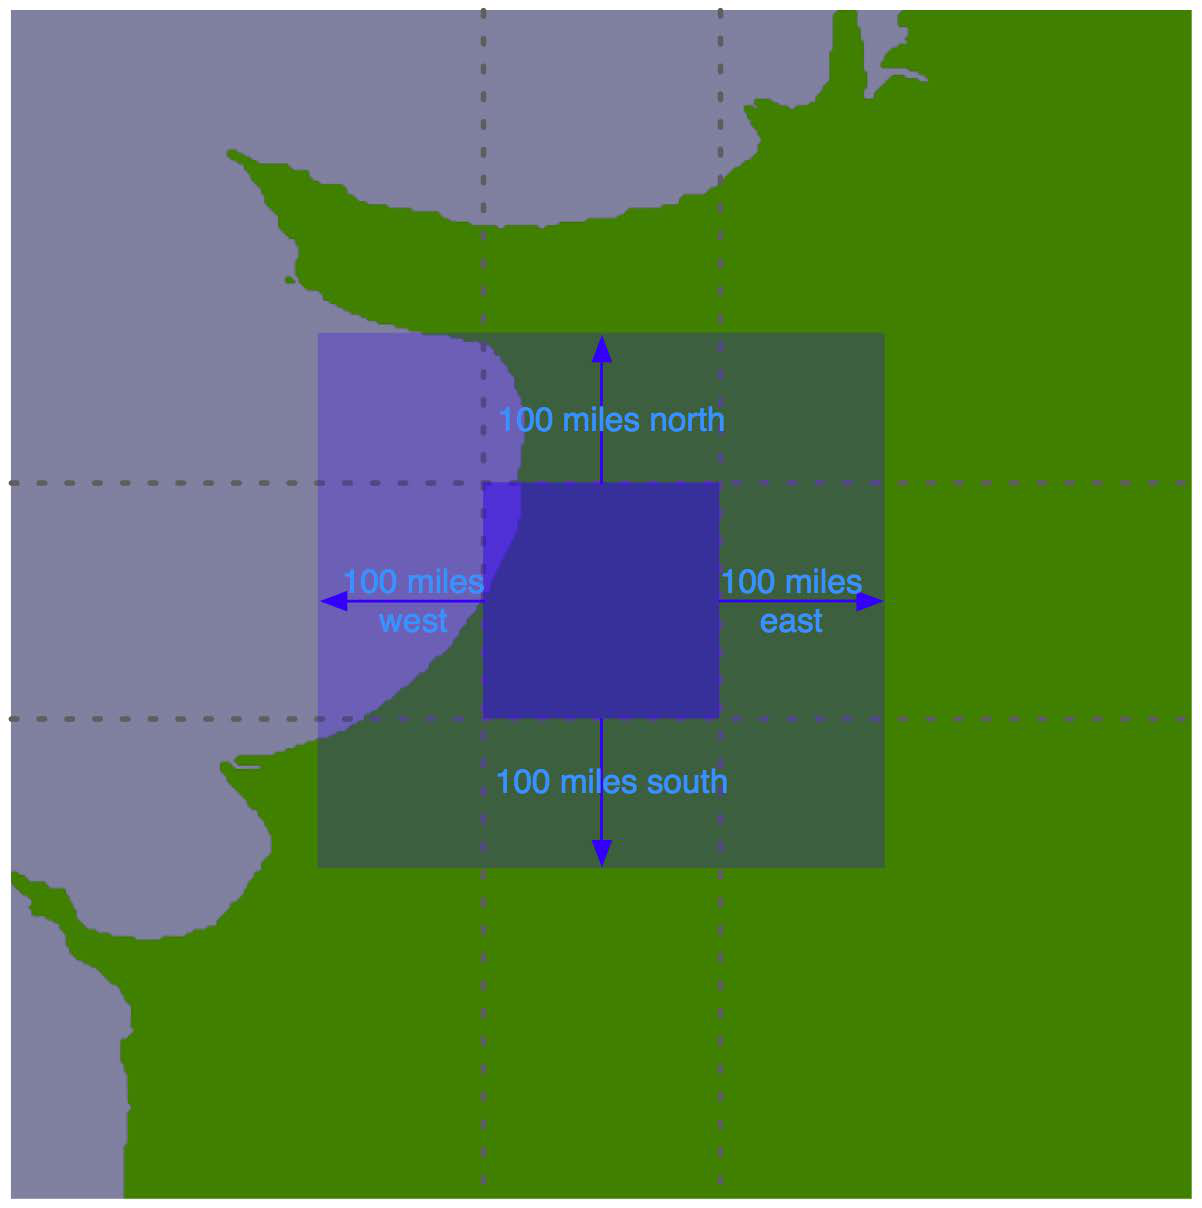
对于每个瓦片,我们将使用之前的方法来确定搜索半径的边界框,以定义一个矩形区域,该区域位于瓦片的100英里以北、以东、以西和以南的位置:
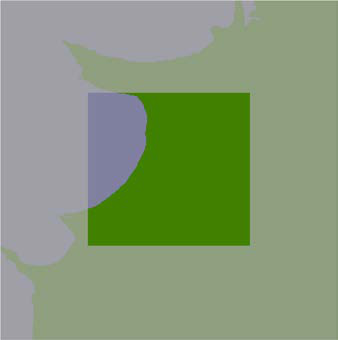
使用边界框,我们可以计算海岸线数据与该边界框的交集:
在瓦片的边界内进行的任何搜索,最多100英里范围内的结果,只会显示该边界框内的海岸线。我们只需将这个交集海岸线存储到数据库中,并存储瓦片的经纬度坐标,然后告诉地图生成器使用适当的瓦片轮廓来显示所需的海岸线。
It is certainly possible to improve the performance of the showResults.py script. As we mentioned in the best practices section of the previous chapter, spatial indexes work best when working with relatively small geometries—and our shoreline polygons are anything but small. However, because the DISTAL application only shows points within a certain distance, we can split these enormous polygons into “tiles” which are then precalculated and stored in the database.
Let’s say that we’re going to impose a limit of 100 miles to the search radius. We’ll also arbitrarily define the tiles to be one whole degree of latitude high, and one whole degree of longitude wide:
备注
Note that we could choose any tile size we like, but have selected whole degrees of longitude and latitude to make it easy to calculate which tile a given lat/long coordinate is inside. Each tile will be given an integer latitude and longitude value, which we’ll call iLat and iLong. We can then calculate the tile to use for any given latitude and longitude like this:
iLat = int(round(latitude))
iLong = int(round(longitude))
We can then simply look up the tile with the given iLat and iLong value.
For each tile, we will use the same technique we used earlier to identify the bounding box of the search radius, to define a rectangle 100 miles north, east, west, and south of the tile:
Using the bounding box, we can calculate the intersection of the shoreline data with this bounding box:
Any search done within the tile’s boundary, up to a maximum of 100 miles in any direction, will only display shorelines within this bounding box. We simply store this intersected shoreline into the database, along with the lat/long coordinates for the tile, and tell the map generator to use the appropriate tile’s outline to display the desired shoreline.
计算平铺海岸线#
Calculating the tiled shorelines
我们来编写一个程序来计算这些瓦片化的海岸线。我们将把这个程序存储为 tileShorelines.py。首先在这个文件中输入以下内容:
import math
import pyproj
from shapely.geometry import Polygon
from shapely.ops import cascaded_union
import shapely.wkt

import database

############################################################

MAX_DISTANCE = 100000 # 最大搜索半径,单位:米。
备注
请注意,我们正在导入 database.py 模块。由于 database.py 位于 cgi-bin 目录中,您应该将 tileShorelines.py 文件放在此目录下。
接下来,我们需要一个函数来计算瓦片的边界框。这个函数 expandRect() 应该接受一个用纬度/经度坐标定义的矩形,并在每个方向上按给定的米数扩展它。使用我们已经学过的技术,这很简单:我们可以使用 pyproj 执行反向大圆计算,以计算给定米数的四个点,分别是起始点以北、以东、以南和以西的点。这将给我们所需的边界框。我们的函数将如下所示:
def expandRect(minLat, minLong, maxLat, maxLong, distance):
    geod = pyproj.Geod(ellps="WGS84")
    midLat = (minLat + maxLat) / 2.0
    midLong = (minLong + maxLong) / 2.0

    try:
        availDistance = geod.inv(midLong, maxLat, midLong,
                                    +90)[2]
        if availDistance >= distance:
            x,y,angle = geod.fwd(midLong, maxLat, 0, distance)
            maxLat = y
        else:
            maxLat = +90
    except:
        maxLat = +90 # 无法向北扩展。

    try:
        availDistance = geod.inv(maxLong, midLat, +180,
                                    midLat)[2]
        if availDistance >= distance:
            x,y,angle = geod.fwd(maxLong, midLat, 90,
                                    distance)
            maxLong = x
        else:
            maxLong = +180
    except:
        maxLong = +180 # 无法向东扩展。

    try:
        availDistance = geod.inv(midLong, minLat, midLong,
                                    -90)[2]
        if availDistance >= distance:
            x,y,angle = geod.fwd(midLong, minLat, 180,
                                    distance)
            minLat = y
        else:
            minLat = -90
    except:
        minLat = -90 # 无法向南扩展。

    try:
        availDistance = geod.inv(maxLong, midLat, -180,
                                    midLat)[2]
        if availDistance >= distance:
            x,y,angle = geod.fwd(minLong, midLat, 270,
                                    distance)
            minLong = x
        else:
            minLong = -180
    except:
        minLong = -180 # 无法向西扩展。

    return (minLat, minLong, maxLat, maxLong)
备注
请注意,我们在这里添加了错误检查,以允许接近南极或北极的矩形。
使用这个函数,我们将能够以以下方式计算给定瓦片的边界矩形:
minLat,minLong,maxLat,maxLong = expandRect(iLat, iLong,
                                            iLat+1, iLong+1,
                                            MAX_DISTANCE)
将 expandRect() 函数输入到您的 tileShorelines.py 脚本中,将其直接放置在最后一个导入语句下方。完成此操作后,我们可以开始创建瓦片化的海岸线。
像往常一样,我们将使用 database.py 模块来处理程序中特定于数据库的部分。我们将从加载海岸线多边形到内存的函数开始。在您的 database.py 模块的末尾添加以下内容:
def load_shorelines():
    global _cursor

    shorelines = []

    if DB_TYPE == "MySQL":
        _cursor.execute("SELECT AsText(outline) " +
                        "FROM shorelines WHERE level=1")
    elif DB_TYPE == "PostGIS":
        _cursor.execute("SELECT ST_AsText(outline) " +
                        "FROM shorelines WHERE level=1")
    elif DB_TYPE == "SpatiaLite":
        _cursor.execute("SELECT ST_AsText(outline) " +
                        "FROM shorelines WHERE level=1")

    for row in _cursor:
        outline = shapely.wkt.loads(row[0])
        shorelines.append(outline)

    return shorelines
备注
这个海岸线瓦片化算法的实现使用了大量的内存。如果您的计算机内存小于2GB,您可能需要将临时结果存储在数据库中。这样做虽然会减慢瓦片化过程,但仍然可以正常工作。
现在我们可以从 tileShorelines.py 脚本中调用这个函数,将海岸线多边形加载到内存中。在您的程序末尾添加以下几行:
database.open()
shorelines = database.load_shorelines()
现在我们已经加载了海岸线多边形,可以开始计算每个瓦片的内容。让我们创建一个列表的列表来保存每个瓦片中(可能被裁剪过的)多边形;在您的 tileShorelines.py 脚本的末尾添加以下内容:
tilePolys = []
for iLat in range(-90, +90):
    tilePolys.append([])
for iLong in range(-180, +180):
    tilePolys[-1].append([])
对于给定的 iLat/iLong 组合,tilePolys[iLat][iLong] 将包含出现在该瓦片内的海岸线多边形的列表。
接下来,我们想要填充 tilePolys 数组,其中包含将出现在每个瓦片中的海岸线部分。显而易见的做法是计算多边形的交集,如下所示:
shorelineInTile = shoreline.intersection(tileBounds)
不幸的是,这种方法计算起来会非常慢——就像生成地图需要大约2-3秒计算出海岸线的可见部分一样,计算一个巨大的海岸线多边形的交集也需要大约2-3秒。因为有 360 x 180 = 64,800 个瓦片,使用这种朴素的方法来完成计算可能需要几天时间。
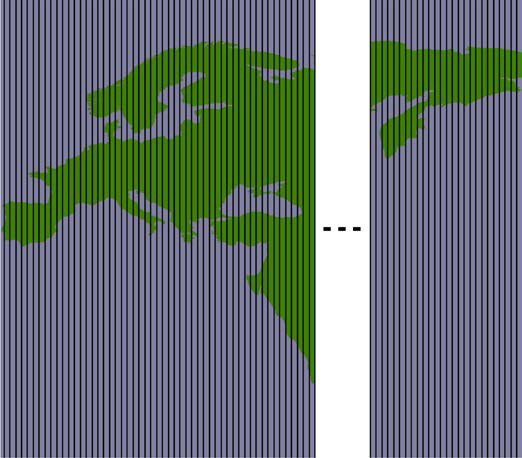
一个更快的解决方案是通过“分而治之”来处理这些大多边形。我们首先将巨大的海岸线多边形分割成垂直条带,如下所示:
然后,我们将每个垂直条带水平切割,以便获得多边形的各个部分,这些部分可以合并到各个瓦片中:

通过将巨大的多边形分割成条带,然后进一步分割每个条带,交集计算的过程变得更快。以下是执行该交集操作的代码;我们首先遍历每个海岸线多边形并计算多边形的边界:
对于每个 shoreline in shorelines:
minLong,minLat,maxLong,maxLat = shoreline.bounds
minLong = int(math.floor(minLong))
minLat = int(math.floor(minLat))
maxLong = int(math.ceil(maxLong))
maxLat = int(math.ceil(maxLat))
然后我们将多边形分割成垂直条带:
vStrips = []
for iLong in range(minLong, maxLong+1):

    stripMinLat = minLat
    stripMaxLat = maxLat
    stripMinLong = iLong
    stripMaxLong = iLong + 1

bMinLat,bMinLong,bMaxLat,bMaxLong = \
    expandRect(stripMinLat, stripMinLong,
                stripMaxLat, stripMaxLong,
                MAX_DISTANCE)

bounds = Polygon([(bMinLong, bMinLat),
                    (bMinLong, bMaxLat),
                    (bMaxLong, bMaxLat),
                    (bMaxLong, bMinLat),
                    (bMinLong, bMinLat)])

strip = shoreline.intersection(bounds)
vStrips.append(strip)
接下来,我们处理每个垂直条带,将条带分割成瓦片大小的块,并将其存储到 tilePolys 中:
stripNum = 0
for iLong in range(minLong, maxLong+1):
    vStrip = vStrips[stripNum]
    stripNum = stripNum + 1

    for iLat in range(minLat, maxLat+1):
        bMinLat,bMinLong,bMaxLat,bMaxLong = \
            expandRect(iLat, iLong, iLat+1, iLong+1,
                        MAX_DISTANCE)

        bounds = Polygon([(bMinLong, bMinLat),
                            (bMinLong, bMaxLat),
                            (bMaxLong, bMaxLat),
                            (bMaxLong, bMinLat),
                            (bMinLong, bMinLat)])

        polygon = vStrip.intersection(bounds)
        if not polygon.is_empty:
            tilePolys[iLat][iLong].append(polygon)
现在我们准备将瓦片化的海岸线保存回数据库。在此之前,我们需要创建相应的数据库表。为此,在 database.py 模块中添加以下函数:
def create_tile_tables():
    global _cursor, _connection

    if DB_TYPE == "MySQL":
        _cursor.execute("""
            CREATE TABLE IF NOT EXISTS tiled_shorelines (
                intLat INTEGER,
                intLong INTEGER,
                outline GEOMETRY,

                PRIMARY KEY (intLat, intLong))
        """)
    elif DB_TYPE == "PostGIS":
        _cursor.execute("DROP TABLE IF EXISTS " +
                        "tiled_shorelines")
        _cursor.execute("""
            CREATE TABLE tiled_shorelines (
                intLat INTEGER,
                intLong INTEGER,

                PRIMARY KEY (intLat, intLong))
        """)
        _cursor.execute("""
            SELECT AddGeometryColumn('tiled_shorelines',
                                        'outline', 4326,
                                        'GEOMETRY', 2)
        """)
        _cursor.execute("""
            CREATE INDEX tiledShorelineIndex
                ON tiled_shorelines
                USING GIST(outline)
        """)
    elif DB_TYPE == "SpatiaLite":
        _cursor.execute("DROP TABLE IF EXISTS " +
                        "tiled_shorelines")
        _cursor.execute("""
            CREATE TABLE tiled_shorelines (
                intLat INTEGER,
                intLong INTEGER,
                PRIMARY KEY (intLat, intLong))
        """)
        _cursor.execute("""
            SELECT AddGeometryColumn('tiled_shorelines',
                                        'outline', 4326,
                                        'GEOMETRY', 2)
        """)
        _cursor.execute("""
            SELECT CreateSpatialIndex('tiled_shorelines',
                                        'outline')
        """)

    _connection.commit()
我们使用与之前创建 countries 和 shorelines 表相同的技术来创建新的 tiled_shorelines 表。现在我们可以从 tileShorelines.py 程序中调用它:
database.create_tile_tables()
因为我们将把几何体(多边形或多重多边形)存储到这个新表中,所以我们需要为每种类型的数据库定义一个函数来执行此操作。在您的 database.py 模块的末尾添加以下内容:
def save_tiled_shoreline(iLat, iLong, outline_wkt):
    global _cursor, _connection

    if DB_TYPE == "MySQL":
        _cursor.execute("INSERT INTO tiled_shorelines " +
                        "(intLat, intLong, outline) " +
                        "VALUES (%s, %s, GeomFromText(%s))",
                        (iLat, iLong, outline_wkt))
    elif DB_TYPE == "PostGIS":
        _cursor.execute("INSERT INTO tiled_shorelines " +
                        "(intLat, intLong, outline) " +
                        "VALUES (%s, %s, " +
                        "ST_GeomFromText(%s, 4326))",
                        (iLat, iLong, outline_wkt))
    elif DB_TYPE == "SpatiaLite":
        _cursor.execute("INSERT INTO tiled_shorelines " +
                        "(intLat, intLong, outline) " +
                        "VALUES (?, ?, " +
                        "ST_GeomFromText(%s, 4326))",
                        (iLat, iLong, outline_wkt))
    _connection.commit()
最后,我们可以将每个瓦片中的多边形列表合并为一个几何对象,并将结果保存到数据库中。在 tileShorelines.py 的末尾添加以下内容:
for iLat in range(-90, +90):
    for iLong in range(-180, +180):
        polygons = tilePolys[iLat][iLong]
        if len(polygons) == 0:
            outline = Polygon()
        else:
            outline = shapely.ops.cascaded_union(polygons)
        wkt = shapely.wkt.dumps(outline)

        database.save_tiled_shoreline(iLat, iLong, wkt)
这完成了我们的海岸线瓦片化程序。您可以通过在命令行中输入以下命令来运行它:
python tileShorelines.py
请注意,由于需要处理大量的海岸线数据,第一次运行该程序可能需要一个小时或更长时间才能完成。
第一次运行程序时,您可能希望将以下这一行替换为:
for shoreline in shorelines:
改为:
for shoreline in shorelines[1:2]:
这将使程序在几分钟内完成,以便您可以确保它正常工作,然后再去掉 [1:2],并在整个海岸线数据库上运行它。
Let’s write the program that calculates these tiled shorelines. We’ll store this program as tileShorelines.py. Start by entering the following into this file:
import math
import pyproj
from shapely.geometry import Polygon
from shapely.ops import cascaded_union
import shapely.wkt

import database

############################################################

MAX_DISTANCE = 100000 # Maximum search radius, in meters.
备注
Note that we’re importing the database.py module. Because database.py is within the cgi-bin directory, you should place your tileShorelines.py file in this directory.
We next need a function to calculate the tile bounding boxes. This function, expandRect(), should take a rectangle defined using lat/long coordinates, and expand it in each direction by a given number of meters. Using the techniques we have learned, this is straightforward: we can use pyproj to perform an inverse great circle calculation to calculate four points the given number of meters north, east, south, and west of the starting point. This will give us the desired bounding box. Here’s what our function will look like:
def expandRect(minLat, minLong, maxLat, maxLong, distance):
    geod = pyproj.Geod(ellps="WGS84")
    midLat = (minLat + maxLat) / 2.0
    midLong = (minLong + maxLong) / 2.0

    try:
        availDistance = geod.inv(midLong, maxLat, midLong,
                                 +90)[2]
        if availDistance >= distance:
            x,y,angle = geod.fwd(midLong, maxLat, 0, distance)
            maxLat = y
        else:
            maxLat = +90
    except:
        maxLat = +90 # Can't expand north.

    try:
        availDistance = geod.inv(maxLong, midLat, +180,
                                 midLat)[2]
        if availDistance >= distance:
            x,y,angle = geod.fwd(maxLong, midLat, 90,
                                 distance)
            maxLong = x
        else:
            maxLong = +180
    except:
        maxLong = +180 # Can't expand east.

    try:
        availDistance = geod.inv(midLong, minLat, midLong,
                                 -90)[2]
        if availDistance >= distance:
            x,y,angle = geod.fwd(midLong, minLat, 180,
                                 distance)
            minLat = y
        else:
            minLat = -90
    except:
        minLat = -90 # Can't expand south.

    try:
        availDistance = geod.inv(maxLong, midLat, -180,
                                 midLat)[2]
        if availDistance >= distance:
            x,y,angle = geod.fwd(minLong, midLat, 270,
                                 distance)
            minLong = x
        else:
            minLong = -180
    except:
        minLong = -180 # Can't expand west.

    return (minLat, minLong, maxLat, maxLong)
备注
Note that we’ve added error-checking here, to allow rectangles close to the north or south pole.
Using this function, we will be able to calculate the bounding rectangle for a given tile in the following way:
minLat,minLong,maxLat,maxLong = expandRect(iLat, iLong,
                                           iLat+1, iLong+1,
                                           MAX_DISTANCE)
Type the expandRect() function into your tileShorelines.py script, placing it immediately below the last import statement. With this in place, we’re now ready to start creating the tiled shorelines.
As always, we’ll be using the database.py module to handle the database-specific portions of our program. We’ll start with a function to load the shoreline polygons into memory. Add the following to the end of your database.py module:
def load_shorelines():
    global _cursor

    shorelines = []

    if DB_TYPE == "MySQL":
        _cursor.execute("SELECT AsText(outline) " +
                        "FROM shorelines WHERE level=1")
    elif DB_TYPE == "PostGIS":
        _cursor.execute("SELECT ST_AsText(outline) " +
                        "FROM shorelines WHERE level=1")
    elif DB_TYPE == "SpatiaLite":
        _cursor.execute("SELECT ST_AsText(outline) " +
                        "FROM shorelines WHERE level=1")

    for row in _cursor:
        outline = shapely.wkt.loads(row[0])
        shorelines.append(outline)

    return shorelines
备注
This implementation of the shoreline tiling algorithm uses a lot of memory. If your computer has less than 2 gigabytes of RAM, you may need to store temporary results in the database. Doing this will of course slow down the tiling process, but it will still work.
We can now call this function from the tileShorelines.py script to load the shoreline polygons into memory. Add the following lines to the end of your program:
database.open()
shorelines = database.load_shorelines()
Now that we’ve loaded the shoreline polygons, we can start calculating the contents of each tile. Let’s create a list-of-lists which will hold the (possibly clipped) polygons that appear within each tile; add the following to the end of your tileShorelines. py script:
tilePolys = []
for iLat in range(-90, +90):
    tilePolys.append([])
for iLong in range(-180, +180):
    tilePolys[-1].append([])
For a given iLat/iLong combination, tilePolys[iLat][iLong] will contain a list of the shoreline polygons which appear inside that tile.
We now want to fill the tilePolys array with the portions of the shorelines that will appear within each tile. The obvious way to do this is to calculate the polygon intersections, like this:
shorelineInTile = shoreline.intersection(tileBounds)
Unfortunately, this approach would take a very long time to calculate—just as the map generation takes about 2-3 seconds to calculate the visible portion of a shoreline, it takes about 2-3 seconds to perform this intersection on a huge shoreline polygon. Because there are 360 x 180 = 64,800 tiles, it would take several days to complete this calculation using this naive approach.
A much faster solution would be to “divide and conquer” the large polygons. We first split the huge shoreline polygon into vertical strips, like this:
We then split each vertical strip horizontally to give us the individual parts of the polygon, which can be merged into the individual tiles:
By dividing the huge polygons into strips, and then further dividing each strip, the intersection process is much faster. Here is the code which performs this intersection; we start by iterating over each shoreline polygon and calculating the polygon’s bounds:
For shoreline in shorelines:
minLong,minLat,maxLong,maxLat = shoreline.bounds
minLong = int(math.floor(minLong))
minLat = int(math.floor(minLat))
maxLong = int(math.ceil(maxLong))
maxLat = int(math.ceil(maxLat))
We then split the polygon into vertical strips:
vStrips = []
for iLong in range(minLong, maxLong+1):

    stripMinLat = minLat
    stripMaxLat = maxLat
    stripMinLong = iLong
    stripMaxLong = iLong + 1

bMinLat,bMinLong,bMaxLat,bMaxLong = \
    expandRect(stripMinLat, stripMinLong,
               stripMaxLat, stripMaxLong,
               MAX_DISTANCE)

bounds = Polygon([(bMinLong, bMinLat),
                  (bMinLong, bMaxLat),
                  (bMaxLong, bMaxLat),
                  (bMaxLong, bMinLat),
                  (bMinLong, bMinLat)])

strip = shoreline.intersection(bounds)
vStrips.append(strip)
Next, we process each vertical strip, splitting the strip into tile-sized blocks and storing it into tilePolys:
stripNum = 0
for iLong in range(minLong, maxLong+1):
    vStrip = vStrips[stripNum]
    stripNum = stripNum + 1

    for iLat in range(minLat, maxLat+1):
        bMinLat,bMinLong,bMaxLat,bMaxLong = \
            expandRect(iLat, iLong, iLat+1, iLong+1,
                       MAX_DISTANCE)

        bounds = Polygon([(bMinLong, bMinLat),
                           (bMinLong, bMaxLat),
                           (bMaxLong, bMaxLat),
                           (bMaxLong, bMinLat),
                           (bMinLong, bMinLat)])

        polygon = vStrip.intersection(bounds)
        if not polygon.is_empty:
            tilePolys[iLat][iLong].append(polygon)
We’re now ready to save the tiled shorelines back into the database. Before we can do that, we have to create the appropriate database tables. To do this, add the following function to your database.py module:
def create_tile_tables():
    global _cursor, _connection

    if DB_TYPE == "MySQL":
        _cursor.execute("""
            CREATE TABLE IF NOT EXISTS tiled_shorelines (
                intLat INTEGER,
                intLong INTEGER,
                outline GEOMETRY,

                PRIMARY KEY (intLat, intLong))
        """)
    elif DB_TYPE == "PostGIS":
        _cursor.execute("DROP TABLE IF EXISTS " +
                        "tiled_shorelines")
        _cursor.execute("""
            CREATE TABLE tiled_shorelines (
                intLat INTEGER,
                intLong INTEGER,

                PRIMARY KEY (intLat, intLong))
        """)
        _cursor.execute("""
            SELECT AddGeometryColumn('tiled_shorelines',
                                     'outline', 4326,
                                     'GEOMETRY', 2)
        """)
        _cursor.execute("""
            CREATE INDEX tiledShorelineIndex
                ON tiled_shorelines
                USING GIST(outline)
        """)
        elif DB_TYPE == "SpatiaLite":
            _cursor.execute("DROP TABLE IF EXISTS " +
                            "tiled_shorelines")
            _cursor.execute("""
                CREATE TABLE tiled_shorelines (
                    intLat INTEGER,
                    intLong INTEGER,
                    PRIMARY KEY (intLat, intLong))
            """)
            _cursor.execute("""
                SELECT AddGeometryColumn('tiled_shorelines',
                                         'outline', 4326,
                                         'GEOMETRY', 2)
            """)
            _cursor.execute("""
                SELECT CreateSpatialIndex('tiled_shorelines',
                                          'outline')
            """)

        _connection.commit()
We’re using the same technique we used earlier to create the countries and shorelines tables to create our new tiled_shorelines table. We can now call this from our tileShorelines.py program:
database.create_tile_tables()
Because we’ll be storing geometries (Polygons or MultiPolygons) into this new table, we’ll want to define a function to do this for each type of database. Add the following to the end of your database.py module:
def save_tiled_shoreline(iLat, iLong, outline_wkt):
    global _cursor, _connection

    if DB_TYPE == "MySQL":
        _cursor.execute("INSERT INTO tiled_shorelines " +
                        "(intLat, intLong, outline) " +
                        "VALUES (%s, %s, GeomFromText(%s))",
                        (iLat, iLong, outline_wkt))
    elif DB_TYPE == "PostGIS":
        _cursor.execute("INSERT INTO tiled_shorelines " +
                        "(intLat, intLong, outline) " +
                        "VALUES (%s, %s, " +
                        "ST_GeomFromText(%s, 4326))",
                        (iLat, iLong, outline_wkt))
    elif DB_TYPE == "SpatiaLite":
        _cursor.execute("INSERT INTO tiled_shorelines " +
                        "(intLat, intLong, outline) " +
                        "VALUES (?, ?, " +
                        "ST_GeomFromText(%s, 4326))",
                        (iLat, iLong, outline_wkt))
    _connection.commit()
Finally, we can combine the list of polygons within each tile into a single Geometry object, and save the results into the database. Add the following to the end of tileShorelines.py:
for iLat in range(-90, +90):
    for iLong in range(-180, +180):
        polygons = tilePolys[iLat][iLong]
        if len(polygons) == 0:
            outline = Polygon()
        else:
            outline = shapely.ops.cascaded_union(polygons)
        wkt = shapely.wkt.dumps(outline)

        database.save_tiled_shoreline(iLat, iLong, wkt)
This completes our program to tile the shorelines. You can run it by typing the following command from the command line:
python tileShorelines.py
Note that it may take an hour or more to complete, because of all the shoreline data that needs to be processed.
The first time you run the program, you might want to replace this line:
for shoreline in shorelines:
with the following line:
for shoreline in shorelines[1:2]:
This will let the program finish in only a few minutes so you can make sure it’s working, before removing the [1:2] and running it over the entire shoreline database.
使用平铺海岸线#
Using tiled shorelines
以下是翻译后的内容,保持了原有的格式:
所有这些为我们提供了一个新的数据库表 tiled_shorelines,该表存储了分成部分重叠瓦片的海岸线数据:

由于我们可以保证给定搜索结果的所有海岸线数据将位于单个 tiled_shoreline 记录中,因此我们可以修改 showResults.py`(以及 `database.py)来使用瓦片化的海岸线数据,而不是原始的海岸线数据。
为了实现这一点,我们需要修改我们的数据源字典,以便 Mapnik 知道使用哪些海岸线瓦片。我们来定义一个新的版本的 get_shoreline_datasource() 函数,该函数返回一个能够处理瓦片化海岸线数据的数据源。将以下内容添加到 database.py 模块的末尾:
def get_tiled_shoreline_datasource(iLat, iLong):
    if DB_TYPE == "MySQL":
        vrtFile = os.path.join(os.path.dirname(__file__),
                                "shorelines.vrt")
        f = file(vrtFile, "w")
        f.write('<OGRVRTDataSource>\n')
        f.write(' <OGRVRTLayer name="shorelines">\n')
        f.write('
        <SrcDataSource>MYSQL:' + MYSQL_DBNAME)
        if MYSQL_USERNAME not in ["", None]:
            f.write(",user=" + MYSQL_USERNAME)
        if MYSQL_PASSWORD not in ["", None]:
            f.write(",passwd=" + MYSQL_PASSWORD)
        f.write(',tables=tiled_shorelines</SrcDataSource>\n')
        f.write('   <SrcSQL>\n')
        f.write('   SELECT outline ' +
                    'FROM tiled_shorelines WHERE ' +
                    '(intLat=%d) AND (intlong=%d)' %
                    (iLat, iLong) + '\n')
        f.write('   </SrcSQL>\n')
        f.write(' </OGRVRTLayer>\n')
        f.write('</OGRVRTDataSource>\n')
        f.close()

        return {'type' : "OGR",
                'file' : vrtFile,
                'layer' : "shorelines"}
    elif DB_TYPE == "PostGIS":
        sql = "(SELECT outline FROM tiled_shorelines" \
            + " WHERE (intLat=%d) AND (intLong=%d)) " \
            % (iLat, iLong) + "AS shorelines"

        return {'type': "PostGIS",
                'dbname': "distal",
                'table': sql,
                'extent_from_subquery' : True,
                'user': POSTGIS_USERNAME,
                'password': POSTGIS_PASSWORD}

    elif DB_TYPE == "SpatiaLite":
        sql = "(SELECT outline FROM tiled_shorelines" \
            + " WHERE (intLat=%d) AND (intLong=%d)) " \
            % (iLat, iLong) + "AS shorelines"

        return {'type': "SQLite",
                'file': SPATIALITE_DBNAME,
                'table': sql,
                'geometry_field' : "outline",
                'key_field': "id"}
现在我们可以在 showResults.py 脚本中使用这个方法来使用瓦片化的海岸线数据。为此,替换掉原来这行代码:
datasource = database.get_shoreline_datasource()
改为以下代码:
iLat = int(round(latitude))

iLong = int(round(longitude))
datasource = database.get_tiled_shoreline_datasource(iLat, iLong)
通过这些修改, showResults.py 脚本将使用瓦片化的海岸线数据,而不是从 GSHHS 下载的完整海岸线数据。现在,让我们看看这些瓦片化的海岸线带来了多大的性能提升。
All this gives us a new database table, tiled_shorelines, which holds the shoreline data split into partly-overlapping tiles:
Since we can guarantee that all the shoreline data for a given set of search results will be within a single tiled_shoreline record, we can modify showResults.py (and database.py) to use the tiled shoreline rather than the raw shoreline data.
To do this, we’ll need to modify our datasource dictionary so that Mapnik will know which of the shoreline tiles to use. Let’s define a new version of the get_shoreline_ datasource() function which returns a data source which can handle our tiled shorelines. Add the following to the end of your database.py module:
def get_tiled_shoreline_datasource(iLat, iLong):
    if DB_TYPE == "MySQL":
        vrtFile = os.path.join(os.path.dirname(__file__),
                               "shorelines.vrt")
        f = file(vrtFile, "w")
        f.write('<OGRVRTDataSource>\n')
        f.write(' <OGRVRTLayer name="shorelines">\n')
        f.write('
        <SrcDataSource>MYSQL:' + MYSQL_DBNAME)
        if MYSQL_USERNAME not in ["", None]:
            f.write(",user=" + MYSQL_USERNAME)
        if MYSQL_PASSWORD not in ["", None]:
            f.write(",passwd=" + MYSQL_PASSWORD)
        f.write(',tables=tiled_shorelines</SrcDataSource>\n')
        f.write('   <SrcSQL>\n')
        f.write('   SELECT outline ' +
                    'FROM tiled_shorelines WHERE ' +
                    '(intLat=%d) AND (intlong=%d)' %
                    (iLat, iLong) + '\n')
        f.write('   </SrcSQL>\n')
        f.write(' </OGRVRTLayer>\n')
        f.write('</OGRVRTDataSource>\n')
        f.close()

        return {'type' : "OGR",
                'file' : vrtFile,
                'layer' : "shorelines"}
    elif DB_TYPE == "PostGIS":
        sql = "(SELECT outline FROM tiled_shorelines" \
            + " WHERE (intLat=%d) AND (intLong=%d)) " \
            % (iLat, iLong) + "AS shorelines"

        return {'type': "PostGIS",
                'dbname': "distal",
                'table': sql,
                'extent_from_subquery' : True,
                'user': POSTGIS_USERNAME,
                'password': POSTGIS_PASSWORD}

    elif DB_TYPE == "SpatiaLite":
        sql = "(SELECT outline FROM tiled_shorelines" \
            + " WHERE (intLat=%d) AND (intLong=%d)) " \
            % (iLat, iLong) + "AS shorelines"

        return {'type': "SQLite",
                'file': SPATIALITE_DBNAME,
                'table': sql,
                'geometry_field' : "outline",
                'key_field': "id"}
We can now use this within our showResults.py script to use the tiled shorelines. To do this, replace the line that says:
datasource = database.get_shoreline_datasource()
with the following code:
iLat = int(round(latitude))

iLong = int(round(longitude))
datasource = database.get_tiled_shoreline_datasource(iLat, iLong)
With these changes, the showResults.py script will use the tiled shorelines rather than the full shoreline data downloaded from GSHHS. Let’s now take a look at how much of a performance improvement these tiled shorelines give us.
分析性能改进#
Analyzing performance improvement
一旦你运行这个新版本的 DISTAL 应用程序,你会立刻注意到速度有了巨大的提升:showResults.py 现在似乎几乎瞬间就返回了结果。之前,地图生成器大约需要 2-3 秒钟生成高分辨率地图,而现在只需要短短的一小部分时间:
Generating map took 0.1074 seconds
这是一个显著的性能提升:地图生成器现在比之前快了 15-20 倍,并且 showResults.py 脚本总共耗时已经不到四分之一秒。对于我们对底层地图数据进行的相对简单的修改来说,这个结果相当不错。
As soon as you run this new version of the DISTAL application, you’ll notice a huge improvement in speed: showResults.py now seems to return its results almost instantly. Where before the map generator was taking about 2-3 seconds to generate the high-resolution maps, it’s now only taking a fraction of a second:
Generating map took 0.1074 seconds
That’s a dramatic improvement in performance: the map generator is now 15-20 times faster than it was, and the total time taken by the showResults.py script is now less than a quarter of a second. That’s not bad for a relatively simple change to our underlying map data.