地图定义文件#
Map definition files
使用 Mapnik 的另一种方法值得一提。除了通过编程方式创建符号化器、规则、样式和图层之外,Mapnik 还允许你使用 地图定义 文件存储所有这些信息。这个文件采用 XML 格式,定义了用于生成地图的各种 Mapnik 对象。例如,考虑下面这个 Python 程序,它使用世界边界数据集创建一个简单的世界地图:
import mapnik

map = mapnik.Map(800, 400)
map.background = mapnik.Color("steelblue")

style = mapnik.Style()
rule = mapnik.Rule()
polySymbolizer = mapnik.PolygonSymbolizer()
polySymbolizer.fill = mapnik.Color("ghostwhite")

stroke = mapnik.Stroke()
stroke.color = mapnik.Color("gray")
stroke.width = 0.1
lineSymbolizer = mapnik.LineSymbolizer(stroke)

rule.symbols.append(polySymbolizer)
rule.symbols.append(lineSymbolizer)
style.rules.append(rule)
map.append_style("My Style", style)

datasource = mapnik.Shapefile(file="TM_WORLD_BORDERS-0.3/" +
                                "TM_WORLD_BORDERS-0.3.shp")

layer = mapnik.Layer("layer")
layer.datasource = datasource
layer.styles.append("My Style")

map.layers.append(layer)

map.zoom_to_box(mapnik.Box2d(-180, -90, +180, +90))
mapnik.render_to_file(map, "map.png")
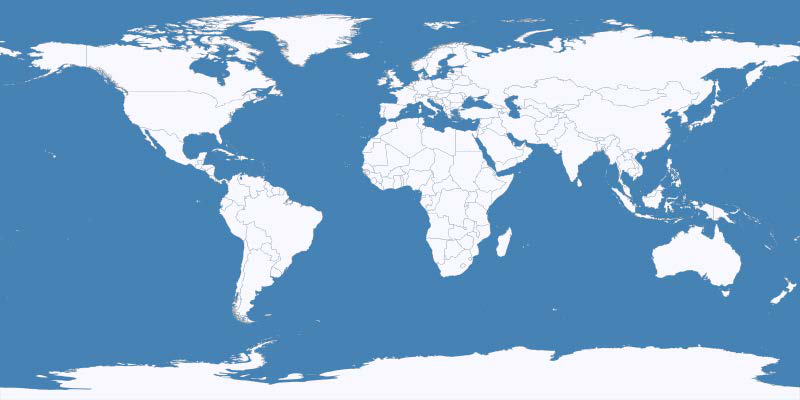
如你所见,这个程序创建了一个包含两个符号化器的规则:一个 PolygonSymbolizer 用于绘制国家的内部,颜色为 “ghostwhite”,另一个 LineSymbolizer 用于绘制轮廓,颜色为灰色。该规则被添加到名为 “My Style” 的样式中,并创建了一个加载世界边界数据集 shapefile 的图层。最后,地图被渲染为名为 map.png 的文件。
以下是渲染结果:
这个程序完全通过 Python 代码编写。现在,考虑以下地图定义文件,它使用 XML 样式表创建与上述程序完全相同的地图:
<?xml version="1.0" encoding="utf-8"?>
<!DOCTYPE Map>

<Map background-color="steelblue" srs="+proj=latlong +datum=WGS84">
    <Style name="My Style">
        <Rule>
            <PolygonSymbolizer fill="ghostwhite"/>
            <LineSymbolizer stroke="gray" stroke-width="0.1"/>
        </Rule>
    </Style>

    <Layer name="world" srs="+proj=latlong +datum=WGS84">
        <StyleName>My Style</StyleName>
        <Datasource>
            <Parameter name="type">shape</Parameter>
            <Parameter name="file">TM_WORLD_BORDERS-0.3/ TM_WORLD_BORDERS-0.3.shp</Parameter>
        </Datasource>
    </Layer>
</Map>
要使用这个样式表,你需要调用 load_map() 函数,将地图定义文件的内容加载到 Mapnik Map 对象中,然后渲染它,如下所示:
map = mapnik.Map(800, 400)
mapnik.load_map(map, "mapDefinition.xml")
map.zoom_to_box(mapnik.Box2d(-180, -90, +180, +90))
mapnik.render_to_file(map, "map.png")
你选择哪种方法完全取决于你。你可能更喜欢将所有编码工作都放在 Python 中(无论是否使用封装模块),或者你可能更喜欢简洁的 XML 样式表定义。除了少数几个例外,你可以用 XML 样式表做 Python 中能做的所有事情,反之亦然。
与 Python 绑定不同,XML 定义文件的格式是彻底记录的。关于地图定义文件语法的更多信息可以在以下网址找到:
http://trac.mapnik.org/wiki/XMLConfigReference
你不必在 XML 中定义所有地图内容或完全在 Python 中做所有事情;Mapnik 支持混合方法,你可以在 XML 文件中定义部分内容,并使用 Python 处理其余部分。例如,你可能希望在 XML 文件中定义 Mapnik 样式,而使用 Python 来定义数据源和地图图层。要做到这一点,你可以这样设置你的地图定义文件:
<?xml version="1.0" encoding="utf-8"?>
<!DOCTYPE Map>

<Map background-color="steelblue" srs="+proj=latlong +datum=WGS84">
    <Style name="My Style">
    <Rule>
        <PolygonSymbolizer fill="ghostwhite"/>
        <LineSymbolizer stroke="gray" stroke-width="0.1"/>
    </Rule>
    </Style>
</Map>
你的 Python 代码将如下所示:
import mapnik

map = mapnik.Map(800, 400)
mapnik.load_map(map, "sampleXMLStylesheet.xml")
datasource = mapnik.Shapefile(file="TM_WORLD_BORDERS-0.3/" +
                                "TM_WORLD_BORDERS-0.3.shp")

layer = mapnik.Layer("layer")
layer.datasource = datasource
layer.styles.append("My Style")

map.layers.append(layer)

map.zoom_to_box(mapnik.Box2d(-180, -90, +180, +90))
mapnik.render_to_file(map, "map.png")
请注意,我们只在 XML 文件中排除了 <Style> 部分,然后使用 Python 创建地图图层。
这种混合方法的优点是将地图的视觉表现和生成它的代码分开。XML 文件定义了用于渲染地图的各种样式,但不包含任何地图生成逻辑。实际上,你可以通过更改 XML 样式表完全改变地图的外观,而无需更改程序中的任何代码行。这非常类似于 HTML 模板引擎在 Web 应用程序中分离表单和功能的方式。
There is one final approach to using Mapnik that is worth examining. In addition to creating your symbolizers, rules, styles, and layers programmatically, Mapnik allows you to store all of this information using a map definition file. This is an XML-format file that defines the various Mapnik objects used to generate a map. For example, consider the following Python program to create a simple world map using the World Borders Dataset:
import mapnik

map = mapnik.Map(800, 400)
map.background = mapnik.Color("steelblue")

style = mapnik.Style()
rule = mapnik.Rule()
polySymbolizer = mapnik.PolygonSymbolizer()
polySymbolizer.fill = mapnik.Color("ghostwhite")

stroke = mapnik.Stroke()
stroke.color = mapnik.Color("gray")
stroke.width = 0.1
lineSymbolizer = mapnik.LineSymbolizer(stroke)

rule.symbols.append(polySymbolizer)
rule.symbols.append(lineSymbolizer)
style.rules.append(rule)
map.append_style("My Style", style)

datasource = mapnik.Shapefile(file="TM_WORLD_BORDERS-0.3/" +
                              "TM_WORLD_BORDERS-0.3.shp")

layer = mapnik.Layer("layer")
layer.datasource = datasource
layer.styles.append("My Style")

map.layers.append(layer)

map.zoom_to_box(mapnik.Box2d(-180, -90, +180, +90))
mapnik.render_to_file(map, "map.png")
As you can see, this program creates a single rule containing two symbolizers: a PolygonSymbolizer to draw the interior of the country in the color named “ghostwhite”, and a LineSymbolizer to draw the outlines in gray. This rule is added to a style named “My Style”, and a single layer is created loading the data from the World Borders Dataset shapefile. Finally, the map is rendered to a file named map.png.
Here is what the resulting map looks like:
This program was written entirely using Python code. Now, consider the following map definition file, which creates exactly the same map using an XML stylesheet:
<?xml version="1.0" encoding="utf-8"?>
<!DOCTYPE Map>

<Map background-color="steelblue" srs="+proj=latlong +datum=WGS84">
    <Style name="My Style">
        <Rule>
            <PolygonSymbolizer fill="ghostwhite"/>
            <LineSymbolizer stroke="gray" stroke-width="0.1"/>
        </Rule>
    </Style>

    <Layer name="world" srs="+proj=latlong +datum=WGS84">
        <StyleName>My Style</StyleName>
        <Datasource>
            <Parameter name="type">shape</Parameter>
            <Parameter name="file">TM_WORLD_BORDERS-0.3/ TM_WORLD_BORDERS-0.3.shp</Parameter>
        </Datasource>
    </Layer>
</Map>
To use this stylesheet, you call the load_map() function to load the contents of the map definition file into a mapnik Map object before rendering it, like this:
map = mapnik.Map(800, 400)
mapnik.load_map(map, "mapDefinition.xml")
map.zoom_to_box(mapnik.Box2d(-180, -90, +180, +90))
mapnik.render_to_file(map, "map.png")
Which approach you take is up to you. You may prefer to do all your coding in Python (with or without a wrapper module), or you might like the more compact XML stylesheet definition. With only a few exceptions, anything you can do in Python can be done with the XML stylesheets, and vice versa.
Unlike the Python bindings, the format for the XML definition file is thoroughly documented. More information on the syntax of the map definition file can be found at:
http://trac.mapnik.org/wiki/XMLConfigReference
You don’t have to choose between doing all your map definition in XML or doing it all in Python; Mapnik supports a hybrid approach where you can define as much or as little in the XML file, and use Python to do the rest. For example, you might like to define your Mapnik styles in the XML file, and use Python to define the data sources and map layers. To do this, you would set up your map definition file like this:
<?xml version="1.0" encoding="utf-8"?>
<!DOCTYPE Map>

<Map background-color="steelblue" srs="+proj=latlong +datum=WGS84">
    <Style name="My Style">
    <Rule>
        <PolygonSymbolizer fill="ghostwhite"/>
        <LineSymbolizer stroke="gray" stroke-width="0.1"/>
    </Rule>
    </Style>
</Map>
Your Python code would then look like this:
import mapnik

map = mapnik.Map(800, 400)
mapnik.load_map(map, "sampleXMLStylesheet.xml")
datasource = mapnik.Shapefile(file="TM_WORLD_BORDERS-0.3/" +
                              "TM_WORLD_BORDERS-0.3.shp")

layer = mapnik.Layer("layer")
layer.datasource = datasource
layer.styles.append("My Style")

map.layers.append(layer)

map.zoom_to_box(mapnik.Box2d(-180, -90, +180, +90))
mapnik.render_to_file(map, "map.png")
Note how we simply exclude the <Style> section from the XML file, and then create our map layers using Python.
This hybrid approach has the advantage of separating out the visual representation of the map from the code used to generate it. The XML file defines the various styles to use for rendering the map but doesn’t include any map-generation logic itself. Indeed, you can completely change the appearance of the map just by changing the XML stylesheet, without having to change a single line of code in your program. This is very similar to the way HTML templating engines separate form and function within a web application.