实现 DISTAL 应用程序#
Implementing the DISTAL application
现在我们已经获得了数据,可以开始实现 DISTAL 应用程序了。为了简化操作,我们将使用 CGI 脚本来实现用户界面。
备注
CGI 脚本并不是实现 DISTAL 应用程序的唯一方法。其他可能的方法包括使用 Web 应用框架,如 TurboGears 或 Django,使用 AJAX 编写自己的动态 Web 应用,使用 CherryPy(http://cherrypy.org),甚至使用像 Pyjamas(http://pyjs.org)这样的工具将 Python 代码编译成 JavaScript。然而,这些方法比 CGI 更复杂,我们将在本章中使用 CGI 脚本,以便尽可能简化代码。
让我们来看一下我们的 CGI 脚本将如何实现 DISTAL 应用程序的工作流:
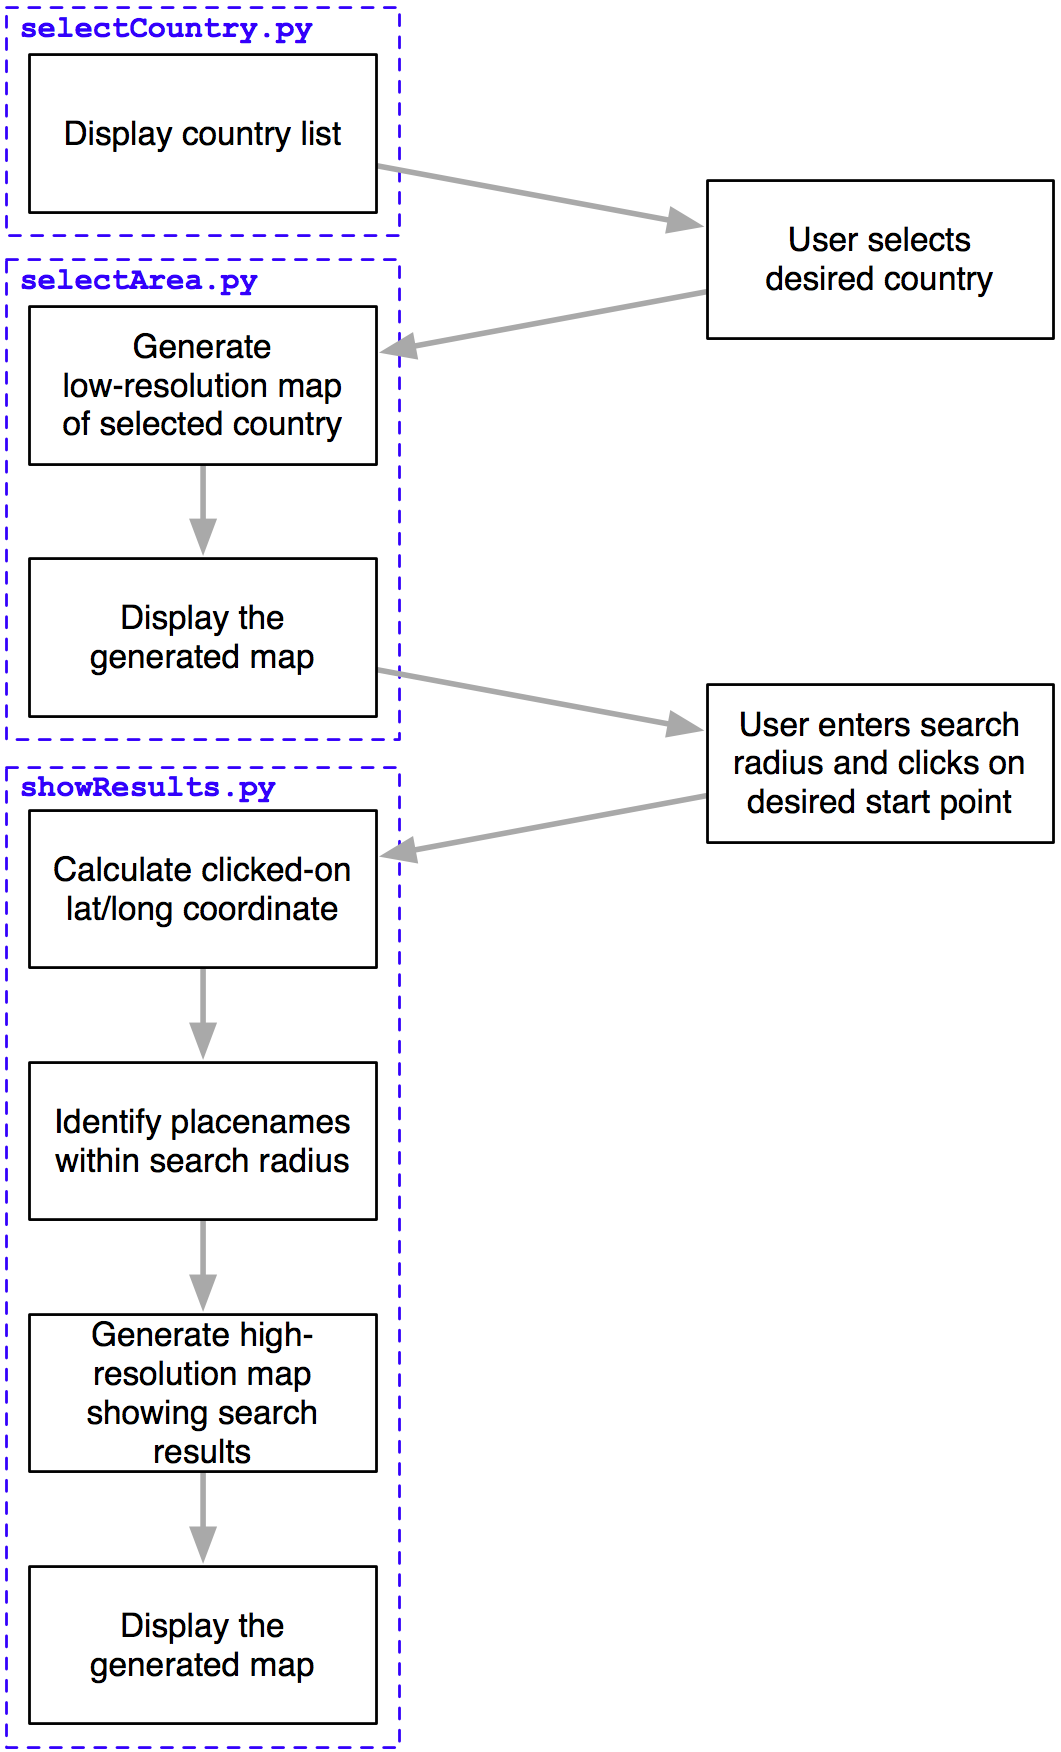
如你所见,有三个独立的 CGI 脚本,分别是 selectCountry.py、selectArea.py 和 showResults.py,每个脚本实现了 DISTAL 应用程序的不同部分。
小技巧
什么是 CGI 脚本?
虽然编写 CGI 脚本的细节超出了本书的范围,但基本概念是将原始 HTML 输出打印到标准输出,并使用内置的 cgi 模块处理来自浏览器的 CGI 参数。
要将 Python 程序作为 CGI 脚本运行,你需要做两件事:首先,在脚本的开头添加一个 “shebang” 行,像这样:
#!/usr/bin/python
对于 MS Windows,添加以下行:
#!C:Python27python.exe -U
你使用的确切路径取决于你在计算机上安装 Python 的位置。
第二件事是,至少在类 Unix 系统上,需要将脚本设置为可执行。例如:
chmod +x selectCountry.py
更多信息,请参见网络上常见的 CGI 教程,例如:[http://wiki.python.org/moin/CgiScripts](http://wiki.python.org/moin/CgiScripts)。
让我们从创建一个简单的 Web 服务器开始,它能够运行我们的 CGI 脚本。对于 Python 来说,这很简单;只需创建以下程序,我们称之为 webServer.py:
import BaseHTTPServer
import CGIHTTPServer

address = ('', 8000)
handler = CGIHTTPServer.CGIHTTPRequestHandler
server = BaseHTTPServer.HTTPServer(address, handler)
server.serve_forever()
接下来,在与 webServer.py 程序相同的目录下创建一个名为 cgi-bin 的子目录。这个子目录将保存你创建的各种 CGI 脚本。
运行 webServer.py 将会在 http://127.0.0.1:8000 设置一个 Web 服务器,执行你放入 cgi-bin 子目录中的任何 CGI 脚本。例如,要访问 selectCountry.py 脚本,你可以在 Web 浏览器中输入以下 URL:
Now that we have the data, we can start to implement the DISTAL application itself. To keep things simple, we will use CGI scripts to implement the user interface.
备注
CGI scripts aren’t the only way we could implement the DISTAL application. Other possible approaches include using web application frameworks such as TurboGears or Django, using AJAX to write your own dynamic web application, using CherryPy (http://cherrypy.org) or even using tools such as Pyjamas (http://pyjs. org) to compile Python code into JavaScript. All of these approaches, however, are more complicated than CGI, and we will be making use of CGI scripts in this chapter to keep the code as straightforward as possible.
Let’s take a look at how our CGI scripts will implement the DISTAL application’s workflow:
As you can see, there are three separate CGI scripts, selectCountry.py, selectArea.py, and showResults.py, each implementing a distinct part of the DISTAL application.
小技巧
What is a CGI Script?
While the details of writing CGI scripts are beyond the scope of this book, the basic concept is to print the raw HTML output to stdout, and to process the incoming CGI parameters from the browser using the built-in cgi module.
To run a Python program as a CGI script, you have to do two things: first, you have to add a “shebang” line to the start of the script, like this:
#!/usr/bin/python
For MS Windows, add the following line:
#!C:Python27python.exe -U
The exact path you use will depend on where you have Python installed on your computer.
The second thing you need to do, at least on Unix-like systems, is make your script executable. For example:
chmod +x selectCountry.py
For more information, see one of the CGI tutorials commonly available on the Internet, for example: http://wiki.python.org/moin/ CgiScripts.
Let’s start by creating a simple web server capable of running our CGI scripts. With Python this is easy; simply create the following program, which we will call webServer.py:
import BaseHTTPServer
import CGIHTTPServer

address = ('', 8000)
handler = CGIHTTPServer.CGIHTTPRequestHandler
server = BaseHTTPServer.HTTPServer(address, handler)
server.serve_forever()
Next, create a subdirectory named cgi-bin within the same directory as your webServer.py program. This subdirectory will hold the various CGI scripts you create.
Running webServer.py will set up a web server at http://127.0.0.1:8000, which will execute any CGI scripts you place into the cgi-bin subdirectory. So, for example, to access the selectCountry.py script, you would enter the following URL into your web browser:
共享“数据库”模块#
The shared “database” module
为了简化操作,我们将把所有与数据库相关的代码放入一个单独的模块中,我们称之为 database.py。下面是该模块的基本结构,并实现了 database.open() 函数,我们将在 CGI 脚本中使用该函数来打开数据库连接:
# database.py

import os.path
import pyproj
from shapely.geometry import Polygon
import shapely.wkt

##############################################################
# 根据需要编辑这些常量,以匹配你的设置。

MYSQL_DBNAME   = "distal"
MYSQL_USERNAME = "XXX"
MYSQL_PASSWORD = "XXX"

POSTGIS_DBNAME = "distal"
POSTGIS_USERNAME = "XXX"
POSTGIS_PASSWORD = "XXX"

SPATIALITE_DB_PATH = os.path.join(os.path.dirname(__file__),
                                    "..", "distal.db")

DB_TYPE = "XXX"

#############################################################

def open():
    global _connection, _cursor

    if DB_TYPE == "MySQL":
        import MySQLdb
        _connection = MySQLdb.connect(user=MYSQL_USERNAME,
                                        passwd=MYSQL_PASSWORD)
        _cursor = _connection.cursor()
        _cursor.execute("USE "+MYSQL_DBNAME)
    elif DB_TYPE == "PostGIS":
        import psycopg2

        params = []
        params.append("dbname=" + POSTGIS_DBNAME)
        if POSTGIS_USERNAME != None:
            params.append("user=" + POSTGIS_USERNAME)
        if POSTGIS_PASSWORD != None:
            params.append("password=" + POSTGIS_PASSWORD)
        _connection = psycopg2.connect(" ".join(params))
        _cursor = _connection.cursor()
    elif DB_TYPE == "SpatiaLite":
        from pysqlite2 import dbapi2 as sqlite
        _connection = sqlite.connect(SPATIALITE_DBNAME)
        _connection.enable_load_extension(True)
        _connection.execute('SELECT load_extension("...")')
        _cursor = _connection.cursor()
    else:
        raise RuntimeError("Unknown database type: " +
                            db_type)
确保将此 database.py 模块放置在与 CGI 脚本相同的目录中。
不要忘记编辑模块顶部的常量,以匹配你特定的设置,输入适当的数据库名称、用户名和密码等。
备注
SPATIALITE_DB_PATH 常量设置为我们 distal.db 文件的绝对路径。我们使用 Python 内置的 __file__ 全局变量,避免将路径硬编码到模块中。
请注意,我们使用私有的全局变量(以单个下划线字符为前缀)来存储数据库连接和游标。这使得我们可以在以后访问这些变量,随着我们向模块添加更多功能。
To make things easier, we’ll put all the database-specific code into a separate module, which we’ll call database.py. Here is the basic structure for this module, along with the implementation of the database.open() function, which we’ll use in our CGI scripts to open a connection to the database:
# database.py

import os.path
import pyproj
from shapely.geometry import Polygon
import shapely.wkt

##############################################################
# Edit these constants as necessary to match your setup.

MYSQL_DBNAME   = "distal"
MYSQL_USERNAME = "XXX"
MYSQL_PASSWORD = "XXX"

POSTGIS_DBNAME = "distal"
POSTGIS_USERNAME = "XXX"
POSTGIS_PASSWORD = "XXX"

SPATIALITE_DB_PATH = os.path.join(os.path.dirname(__file__),
                                  "..", "distal.db")

DB_TYPE = "XXX"

#############################################################

def open():
    global _connection, _cursor

    if DB_TYPE == "MySQL":
        import MySQLdb
        _connection = MySQLdb.connect(user=MYSQL_USERNAME,
                                      passwd=MYSQL_PASSWORD)
        _cursor = _connection.cursor()
        _cursor.execute("USE "+MYSQL_DBNAME)
    elif DB_TYPE == "PostGIS":
        import psycopg2

        params = []
        params.append("dbname=" + POSTGIS_DBNAME)
        if POSTGIS_USERNAME != None:
            params.append("user=" + POSTGIS_USERNAME)
        if POSTGIS_PASSWORD != None:
            params.append("password=" + POSTGIS_PASSWORD)
        _connection = psycopg2.connect(" ".join(params))
        _cursor = _connection.cursor()
    elif DB_TYPE == "SpatiaLite":
        from pysqlite2 import dbapi2 as sqlite
        _connection = sqlite.connect(SPATIALITE_DBNAME)
        _connection.enable_load_extension(True)
        _connection.execute('SELECT load_extension("...")')
        _cursor = _connection.cursor()
    else:
        raise RuntimeError("Unknown database type: " +
                           db_type)
Make sure you place this database.py module into the same directory as your CGI scripts.
Don’t forget to edit the constants at the top of the module to match your particular setup, entering the appropriate database names, usernames and passwords, and so on.
备注
The SPATIALITE_DB_PATH constant is set to the absolute path to our distal.db file. We use the Python’s built-in __file__ global to avoid having to hardwire paths into our module.
Note that we use private global variables (prefixed with an underscore character) to store the database connection and cursor. This lets us access these variables later on, as we add more functions to this module.
“选择国家”脚本#
The “select country” script
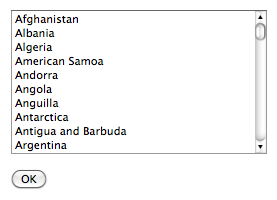
selectCountry.py 脚本的任务是向用户显示一个国家列表,以便用户选择一个所需的国家,然后将所选国家传递给 selectArea.py 脚本以进行进一步处理。
以下是 selectCountry.py 脚本输出的样子:
这个 CGI 脚本非常基础:我们只需要打印出 HTML 页面内容,让用户从一个国家名称列表中选择一个国家:
#!/usr/bin/python

import database
database.open()

print 'Content-Type: text/html; charset=UTF-8\n\n'
print '<html>'
print '<head><title>Select Country</title></head>'
print '<body>'
print '<form method="POST" action="selectArea.py">'
print '<select name="countryID" size="10">'

for id,name in database.list_countries():
    print '<option value="'+str(id)+'">'+name+'</option>'

print '</select>'
print '<p>'
print '<input type="submit" value="OK">'
print '</form>'
print '</body>'
print '</html>'
小技巧
理解 HTML 表单
如果你之前没有使用过 HTML 表单,别担心。它们非常简单,如果你愿意,你可以直接复制这里给出的示例代码。如果想了解更多关于 HTML 表单的信息,可以查阅网上的许多教程。一个不错的例子可以在 http://www.pagetutor.com/form_tutor 找到。
如你所见,我们在 database 模块中调用了 list_countries() 函数,返回了一个国家记录的 ID 和关联的名称列表。该函数的实现很简单;只需在 database.py 模块中添加以下代码:
def list_countries():
    global _cursor
    results = []
    _cursor.execute("SELECT id,name FROM countries " +
                    "ORDER BY name")
    for id,name in _cursor:
        results.append((id, name))
    return results
不幸的是,这段代码有一个问题:由于 SpatiaLite 无法处理 UTF-8 字符编码,我们必须在返回之前手动将国家名称从 Unicode 转换为 UTF-8。我们可以通过在函数中添加以下高亮部分来完成此操作:
这完成了“选择国家”脚本的编写。现在,你应该能够通过在浏览器中输入以下 URL 来运行它:
http://127.0.0.1:8000/cgi-bin/selectCountry.py
如果一切顺利,你应该能看到国家列表,并且能够选择一个国家。如果你点击 OK 按钮,你应该会看到一个 404 错误,表示 selectArea.py 脚本尚未存在——这完全正确,因为我们还没有实现它。
The task of the selectCountry.py script is to display a list of countries to the user, so that the user can choose a desired country which is then passed to the selectArea.py script for further processing.
Here is what the selectCountry.py script’s output will look like:
This CGI script is very basic: we simply print out the contents of the HTML page which lets the user choose a country from a list of country names:
#!/usr/bin/python

import database
database.open()

print 'Content-Type: text/html; charset=UTF-8\n\n'
print '<html>'
print '<head><title>Select Country</title></head>'
print '<body>'
print '<form method="POST" action="selectArea.py">'
print '<select name="countryID" size="10">'

for id,name in database.list_countries():
    print '<option value="'+str(id)+'">'+name+'</option>'

print '</select>'
print '<p>'
print '<input type="submit" value="OK">'
print '</form>'
print '</body>'
print '</html>'
小技巧
Understanding HTML Forms
If you haven’t used HTML forms before, don’t panic. They are quite straightforward, and if you want you can just copy the code from the examples given here. To learn more about HTML forms, check out one of the many tutorials available online. A good example can be found at http://www.pagetutor.com/form_tutor.
As you can see, we call the list_countries() function within the database module to return a list of country record IDs and their associated names. The implementation of this function is straightforward; simply add the following code to your database. py module:
def list_countries():
    global _cursor
    results = []
    _cursor.execute("SELECT id,name FROM countries " +
                    "ORDER BY name")
    for id,name in _cursor:
        results.append((id, name))
    return results
Unfortunately, there is a problem with this code: because SpatiaLite can’t handle UTF-8 character encoding, we have to manually convert the country name from Unicode to UTF-8 before returning it. We can do this by adding the following highlighted lines to our function:
This completes the “select country” script. You should now be able to run it by typing the following URL in your web browser:
http://127.0.0.1:8000/cgi-bin/selectCountry.py
All going well, you should see the list of countries and be able to select one. If you click on the OK button, you should see a 404 error, indicating that the selectArea. py script doesn’t exist yet—which is perfectly correct, as we haven’t implemented it yet.
“选择区域”脚本#
The “select area” script
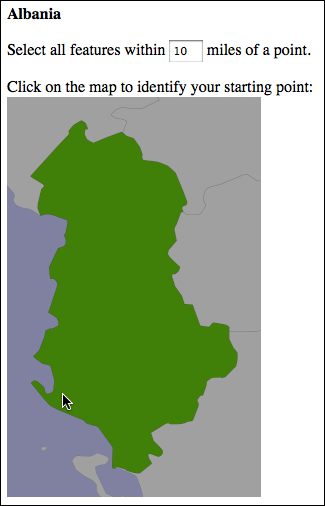
DISTAL 应用程序的下一个部分是 selectArea.py。这个脚本生成一个显示所选国家简单地图的网页。用户可以输入所需的搜索半径并点击地图以标识 DISTAL 搜索的起点:
为了使这个脚本正常工作,我们需要一种生成地图的方法。使用 Mapnik 工具包来生成地图将在第 8 章《使用 Python 和 Mapnik 生成地图》中详细介绍;现在,我们将创建一个独立的 mapGenerator.py 模块,该模块负责地图的渲染,以便我们可以专注于 DISTAL 应用程序的其他部分。
以下是 mapGenerator.py 模块的完整源代码,该模块应该放在你的 cgi-bin 目录中:
# mapGenerator.py

import os, os.path, sys, tempfile
import mapnik

def generateMap(datasource, minX, minY, maxX, maxY,
                mapWidth, mapHeight,
                hiliteExpr=None, background="#8080a0",
                hiliteLine="#000000", hiliteFill="#408000",
                normalLine="#404040", normalFill="#a0a0a0",
                points=None):
srcType = datasource['type']
del datasource['type']

if srcType == "OGR":
    source = mapnik.Ogr(**datasource)
elif srcType == "PostGIS":
    source = mapnik.PostGIS(**datasource)
elif srcType == "SQLite":
    source = mapnik.SQLite(**datasource)

layer = mapnik.Layer("Layer")
layer.datasource = source

map = mapnik.Map(mapWidth, mapHeight,
                    '+proj=longlat +datum=WGS84')
map.background = mapnik.Color(background)

style = mapnik.Style()

rule = mapnik.Rule()

if hiliteExpr != None:
    rule.filter = mapnik.Filter(hiliteExpr)

rule.symbols.append(mapnik.PolygonSymbolizer(
    mapnik.Color(hiliteFill)))
rule.symbols.append(mapnik.LineSymbolizer(
    mapnik.Stroke(mapnik.Color(hiliteLine), 0.1)))

style.rules.append(rule)

rule = mapnik.Rule()
rule.set_else(True)

rule.symbols.append(mapnik.PolygonSymbolizer(
    mapnik.Color(normalFill)))
rule.symbols.append(mapnik.LineSymbolizer(
    mapnik.Stroke(mapnik.Color(normalLine), 0.1)))

style.rules.append(rule)

map.append_style("Map Style", style)
layer.styles.append("Map Style")
map.layers.append(layer)

if points != None:
    memoryDatasource = mapnik.MemoryDatasource()
    context = mapnik.Context()
    context.push("name")
    next_id = 1
    for long,lat,name in points:
        wkt = "POINT (%0.8f %0.8f)" % (long,lat)
        feature = mapnik.Feature(context, next_id)
        feature['name'] = name
        feature.add_geometries_from_wkt(wkt)
        next_id = next_id + 1
        memoryDatasource.add_feature(feature)

    layer = mapnik.Layer("Points")
    layer.datasource = memoryDatasource

    style = mapnik.Style()
    rule = mapnik.Rule()

    pointImgFile = os.path.join(os.path.dirname(__file__),
                                "point.png")

    shield = mapnik.ShieldSymbolizer(
                mapnik.Expression('[name]'),
                "DejaVu Sans Bold", 10,
                mapnik.Color("#000000"),
                mapnik.PathExpression(pointImgFile))
    shield.displacement(0, 7)
    shield.unlock_image = True
    rule.symbols.append(shield)

    style.rules.append(rule)

    map.append_style("Point Style", style)
    layer.styles.append("Point Style")

    map.layers.append(layer)

map.zoom_to_box(mapnik.Envelope(minX, minY, maxX, maxY))

scriptDir = os.path.dirname(__file__)
cacheDir = os.path.join(scriptDir, "..", "mapCache")
if not os.path.exists(cacheDir):
    os.mkdir(cacheDir)
fd,filename = tempfile.mkstemp(".png", dir=cacheDir)
os.close(fd)

mapnik.render_to_file(map, filename, "png")

return "../mapCache/" + os.path.basename(filename)
不用过多担心这个模块的细节;所有内容将在第 8 章《使用 Python 和 Mapnik 生成地图》中解释。与此同时,可以按照原样使用此模块。需要注意的两件事是:
你需要在计算机上安装 Mapnik 才能使此模块正常工作。可以在 http://mapnik.org 找到 Mapnik 工具包。
此模块需要一个小的图像文件,用于在地图上标记地名。该图像是 9x9 像素,看起来像这样:

这张图片是本书示例源代码的一部分。如果你没有访问示例代码,可以创建或查找一个类似的图像;确保图像命名为 point.png 并放置在与 mapGenerator.py 模块相同的目录中。
现在,我们已经准备好开始查看 selectArea.py 脚本。我们从 shebang 行和导入所需的各种模块开始:
#!/usr/bin/python

import cgi, os.path, sys
import shapely.wkt
import database
import mapGenerator
接下来,我们定义一些有用的常量:
HEADER = "Content-Type: text/html; charset=UTF-8\n\n" \
        + "<html><head><title>Select Area</title>" \
        + "</head><body>"

FOOTER = "</body></html>"

MAX_WIDTH = 600
MAX_HEIGHT = 400
然后,我们打开数据库:
database.open()
接下来的任务是提取用户点击的国家的 ID:
form = cgi.FieldStorage()
if not form.has_key("countryID"):
    print HEADER
    print '<b>Please select a country</b>'
    print FOOTER
    sys.exit(0)

countryID = int(form['countryID'].value)
现在我们已经有了所选国家的 ID,准备开始生成地图。这个过程分为四个步骤:
计算定义要显示的世界区域的边界框
计算地图的尺寸
设置数据源
渲染地图图像
接下来,我们将逐一查看每个步骤。
The next part of the DISTAL application is selectArea.py. This script generates a web page that displays a simple map of the selected country. The user can enter a desired search radius and click on the map to identify the starting point for the DISTAL search:
For this script to work, we’re going to need some way of generating a map. Map generation using the Mapnik toolkit will be covered in detail in Chapter 8, Using Python and Mapnik to Generate Maps; for now, we are going to create a standalone mapGenerator.py module, which does the map rendering for us so that we can focus on the other aspects of the DISTAL application. Here is the full source code for the mapGenerator.py module, which should be placed in your cgi-bin directory:
# mapGenerator.py

import os, os.path, sys, tempfile
import mapnik

def generateMap(datasource, minX, minY, maxX, maxY,
                mapWidth, mapHeight,
                hiliteExpr=None, background="#8080a0",
                hiliteLine="#000000", hiliteFill="#408000",
                normalLine="#404040", normalFill="#a0a0a0",
                points=None):
srcType = datasource['type']
del datasource['type']

if srcType == "OGR":
    source = mapnik.Ogr(**datasource)
elif srcType == "PostGIS":
    source = mapnik.PostGIS(**datasource)
elif srcType == "SQLite":
    source = mapnik.SQLite(**datasource)

layer = mapnik.Layer("Layer")
layer.datasource = source

map = mapnik.Map(mapWidth, mapHeight,
                 '+proj=longlat +datum=WGS84')
map.background = mapnik.Color(background)

style = mapnik.Style()

rule = mapnik.Rule()

if hiliteExpr != None:
    rule.filter = mapnik.Filter(hiliteExpr)

rule.symbols.append(mapnik.PolygonSymbolizer(
    mapnik.Color(hiliteFill)))
rule.symbols.append(mapnik.LineSymbolizer(
    mapnik.Stroke(mapnik.Color(hiliteLine), 0.1)))

style.rules.append(rule)

rule = mapnik.Rule()
rule.set_else(True)

rule.symbols.append(mapnik.PolygonSymbolizer(
    mapnik.Color(normalFill)))
rule.symbols.append(mapnik.LineSymbolizer(
    mapnik.Stroke(mapnik.Color(normalLine), 0.1)))

style.rules.append(rule)

map.append_style("Map Style", style)
layer.styles.append("Map Style")
map.layers.append(layer)

if points != None:
    memoryDatasource = mapnik.MemoryDatasource()
    context = mapnik.Context()
    context.push("name")
    next_id = 1
    for long,lat,name in points:
        wkt = "POINT (%0.8f %0.8f)" % (long,lat)
        feature = mapnik.Feature(context, next_id)
        feature['name'] = name
        feature.add_geometries_from_wkt(wkt)
        next_id = next_id + 1
        memoryDatasource.add_feature(feature)

    layer = mapnik.Layer("Points")
    layer.datasource = memoryDatasource

    style = mapnik.Style()
    rule = mapnik.Rule()

    pointImgFile = os.path.join(os.path.dirname(__file__),
                                "point.png")

    shield = mapnik.ShieldSymbolizer(
                mapnik.Expression('[name]'),
                "DejaVu Sans Bold", 10,
                mapnik.Color("#000000"),
                mapnik.PathExpression(pointImgFile))
    shield.displacement(0, 7)
    shield.unlock_image = True
    rule.symbols.append(shield)

    style.rules.append(rule)

    map.append_style("Point Style", style)
    layer.styles.append("Point Style")

    map.layers.append(layer)

map.zoom_to_box(mapnik.Envelope(minX, minY, maxX, maxY))

scriptDir = os.path.dirname(__file__)
cacheDir = os.path.join(scriptDir, "..", "mapCache")
if not os.path.exists(cacheDir):
    os.mkdir(cacheDir)
fd,filename = tempfile.mkstemp(".png", dir=cacheDir)
os.close(fd)

mapnik.render_to_file(map, filename, "png")

return "../mapCache/" + os.path.basename(filename)
Don’t worry too much about the details of this module; everything will be explained in Chapter 8, Using Python and Mapnik to Generate Maps. In the meantime, just use this module as written. There are just two things to be aware of:
You need to have Mapnik installed on your computer for this module to work. The Mapnik toolkit can be found at http://mapnik.org.
This module requires a small image file that is used to mark place names on the map. This 9 x 9 pixel image looks like this:
This preceding image is available as part of the example source code that comes with this book. If you don’t have access to the example code, you can create or search for an image that looks like this; make sure the image is named point.png and is placed into the same directory as the mapGenerator.py module itself.
We’re now ready to start looking at the selectArea.py script itself. We’ll start with our shebang line and import the various modules we’ll need:
#!/usr/bin/python

import cgi, os.path, sys
import shapely.wkt
import database
import mapGenerator
Next, we define some useful constants:
HEADER = "Content-Type: text/html; charset=UTF-8\n\n" \
       + "<html><head><title>Select Area</title>" \
       + "</head><body>"

FOOTER = "</body></html>"

MAX_WIDTH = 600
MAX_HEIGHT = 400
Then we open up the database:
database.open()
Our next task is to extract the ID of the country the user clicked on:
form = cgi.FieldStorage()
if not form.has_key("countryID"):
    print HEADER
    print '<b>Please select a country</b>'
    print FOOTER
    sys.exit(0)

countryID = int(form['countryID'].value)
Now that we have the ID of the selected country, we’re ready to start generating the map. Doing this is a four-step process:
Calculate the bounding box that defines the portion of the world to be displayed
Calculate the map’s dimensions
Set up the data source
Render the map image
Let’s look at each of these in turn.
计算边界框#
Calculating the bounding box
在我们能够在地图上显示所选国家之前,我们需要计算该国家的边界框——即最小和最大纬度与经度值。知道了边界框后,我们可以绘制以所需国家为中心的地图。如果不这样做,地图将覆盖整个世界。
让我们从向数据库模块中添加一个函数开始,以提取所选国家所需的信息:
def get_country_details(country_id):
    global _cursor

    if DB_TYPE == "MySQL":
        _cursor.execute("SELECT name," +
                        "AsText(Envelope(outline)) " +
                        "FROM countries WHERE id=%s",
                        (country_id,))
    elif DB_TYPE == "PostGIS":
        _cursor.execute("SELECT name," +
                        "ST_AsText(ST_Envelope(outline)) " +
                        "FROM countries WHERE id=%s",
                        (country_id,))
    elif DB_TYPE == "SpatiaLite":
        _cursor.execute("SELECT name," +
                        "ST_AsText(ST_Envelope(outline)) " +
                        "FROM countries WHERE id=?",
                        (country_id,))

    row = _cursor.fetchone()
    if row != None:
        return {'name'       : row[0],
                'bounds_wkt' : row[1]}
    else:
        return None
这个函数返回给定国家的名称和它的边界框,以 WKT 格式的字符串形式。注意我们首先计算国家轮廓的封闭范围(或边界框),然后使用 AsText 函数将该边界框转换为 WKT 字符串。
有了这个函数,我们现在可以在 selectArea.py 脚本中添加必要的代码,以计算要在地图上显示的区域;只需将以下代码添加到 CGI 脚本的末尾:
details = database.get_country_details(countryID)

envelope = shapely.wkt.loads(details['bounds_wkt'])
minLong,minLat,maxLong,maxLat = envelope.bounds
minLong = minLong - 0.2
minLat = minLat - 0.2
maxLong = maxLong + 0.2
maxLat = maxLat + 0.2
正如你所见,我们使用 Shapely 提取最小和最大纬度与经度值,然后稍微增加这些边界值,以便国家不会紧贴地图边缘。
现在代码有一个小问题:如果指定了无效的国家 ID,我们的程序会崩溃。为了解决这个问题,请在调用 database.get_country_details() 之后立即添加以下错误处理代码:
if details == None:
    print HEADER
    print '<b>Missing Country ' + repr(countryID) + '</b>'
    print FOOTER
    sys.exit(0)
Before we can show the selected country on a map, we need to calculate the bounding box for that country—that is, the minimum and maximum latitude and longitude values. Knowing the bounding box allows us to draw a map centered over the desired country. If we didn’t do this, the map would cover the entire world.
Let’s start by adding a function to our database module to extract the information we need about the selected country:
def get_country_details(country_id):
    global _cursor

    if DB_TYPE == "MySQL":
        _cursor.execute("SELECT name," +
                        "AsText(Envelope(outline)) " +
                        "FROM countries WHERE id=%s",
                        (country_id,))
    elif DB_TYPE == "PostGIS":
        _cursor.execute("SELECT name," +
                        "ST_AsText(ST_Envelope(outline)) " +
                        "FROM countries WHERE id=%s",
                        (country_id,))
    elif DB_TYPE == "SpatiaLite":
        _cursor.execute("SELECT name," +
                        "ST_AsText(ST_Envelope(outline)) " +
                        "FROM countries WHERE id=?",
                        (country_id,))

    row = _cursor.fetchone()
    if row != None:
        return {'name'       : row[0],
                'bounds_wkt' : row[1]}
    else:
        return None
This function returns the given country’s name and its bounding box as a WKT-format string. Note how we first calculate the envelope (or bounding box) for the country’s outline, and then convert that envelope into a WKT string using the AsText function.
With this function in place, we can now add the necessary code to our selectArea. py script to calculate the area of the world to display on our map; simply add the following to the end of your CGI script:
details = database.get_country_details(countryID)

envelope = shapely.wkt.loads(details['bounds_wkt'])
minLong,minLat,maxLong,maxLat = envelope.bounds
minLong = minLong - 0.2
minLat = minLat - 0.2
maxLong = maxLong + 0.2
maxLat = maxLat + 0.2
As you can see, we use Shapely to extract the minimum and maximum latitude and longitude values, and then increase these bounds slightly so that the country won’t butt up against the edge of the map.
There’s just one problem with our code: if an invalid country ID was specified, our program will crash. To get around this, add the following error-handling code to the script, immediately below the call to database.get_country_details():
if details == None:
    print HEADER
    print '<b>Missing Country ' + repr(countryID) + '</b>'
    print FOOTER
    sys.exit(0)
计算地图尺寸#
Calculating the map’s dimensions
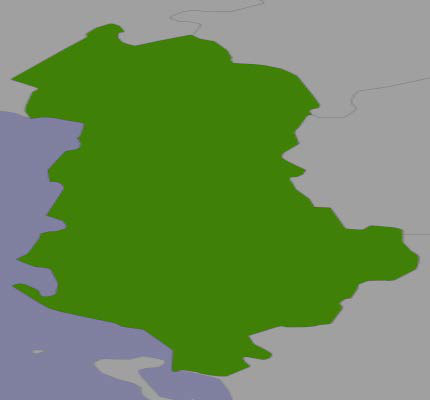
边界框不仅仅有助于缩放到地图的所需部分:它还帮助我们正确地定义地图的尺寸。请注意,前面的阿尔巴尼亚地图显示该国比宽度更高。如果你天真地将这张地图绘制成一个正方形图像,阿尔巴尼亚将看起来是这样的:
更糟糕的是,智利会看起来是这样的:
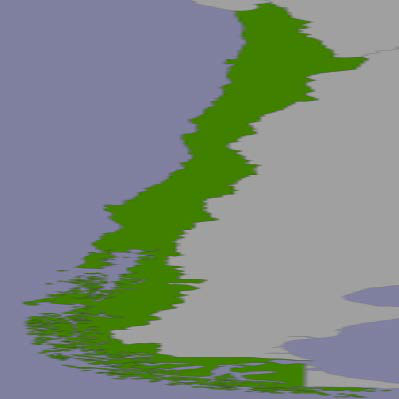
而不是这样:

备注
这是一种简化;虽然大多数地图工具包会尽量保持地图的纵横比,但它们的行为是不可预测的,这意味着你无法准确地识别点击点的经纬度坐标。
为了正确显示国家,我们需要计算该国家的纵横比(即宽度与高度的比例),然后基于这个纵横比计算地图图像的大小,同时限制图像的总体尺寸,以便它能够适应网页。以下是必要的代码,你应该将其添加到 selectArea.py 脚本的末尾:
width = float(maxLong - minLong)
height = float(maxLat - minLat)
aspectRatio = width / height

mapWidth = MAX_WIDTH
mapHeight = int(mapWidth / aspectRatio)

if mapHeight > MAX_HEIGHT:
    # 缩放地图以适应。
    scaleFactor = float(MAX_HEIGHT) / float(mapHeight)
    mapWidth = int(mapWidth * scaleFactor)
    mapHeight = int(mapHeight * scaleFactor)
这样做意味着地图的尺寸将正确反映我们正在显示的国家的维度。
The bounding box isn’t useful only to zoom in on the desired part of the map: it also helps us to correctly define the map’s dimensions. Note that the preceding map of Albania shows the country as being taller than it is wide. If you were to naively draw this map as a square image, Albania would end up looking like this:
Even worse, Chile would look like this:
Rather than this:
备注
This is a slight simplification; the mapping toolkits generally do try to preserve the aspect ratio for a map, but their behavior is unpredictable and means that you can’t identify the lat/long coordinates for a clicked-on point.
To display the country correctly, we need to calculate the country’s aspect ratio (its width as a proportion of its height) and then calculate the size of the map image based on this aspect ratio, while limiting the overall size of the image so that it can fit within a web page. Here’s the necessary code, which you should add to the end of your selectArea.py script:
width = float(maxLong - minLong)
height = float(maxLat - minLat)
aspectRatio = width/height

mapWidth = MAX_WIDTH
mapHeight = int(mapWidth / aspectRatio)

if mapHeight > MAX_HEIGHT:
    # Scale the map to fit.
    scaleFactor = float(MAX_HEIGHT) / float(mapHeight)
    mapWidth = int(mapWidth * scaleFactor)
    mapHeight = int(mapHeight * scaleFactor)
Doing this means that the map is correctly sized to reflect the dimensions of the country we are displaying.
设置数据源#
Setting up the data source
数据源告诉地图生成器如何访问底层的地图数据。数据源的工作原理超出了本章的范围;现在,我们只需设置所需的数据源字典和相关文件,以便我们可以生成地图。请注意,这个字典的内容会根据你使用的数据库以及你尝试访问的表不同而有所变化;在本例中,我们尝试显示来自 countries 表的选定特征。为了解决这个问题,我们将在数据库模块中创建一个新的函数,用于为我们特定的数据库设置数据源:
def get_country_datasource():
    if DB_TYPE == "MySQL":
        vrtFile = os.path.join(os.path.dirname(__file__),
                            "countries.vrt")

        f = file(vrtFile, "w")
        f.write('<OGRVRTDataSource>\n')
        f.write(' <OGRVRTLayer name="countries">\n')
        f.write('   <SrcDataSource>MySQL:' + MYSQL_DBNAME)
        if MYSQL_USERNAME != None:
            f.write(",user=" + MYSQL_USERNAME)
        if MYSQL_PASSWORD != None:
            f.write(",passwd=" + MYSQL_PASSWORD)
        f.write('</SrcDataSource>\n')
        f.write('   <SrcSQL>SELECT id,outline ' +
                    'FROM countries</SrcSQL>\n')
        f.write(' </OGRVRTLayer>\n')
        f.write('</OGRVRTDataSource>\n')
        f.close()

        return {'type' : "OGR",
                'file' : vrtFile,
                'layer' : "countries"}

    elif DB_TYPE == "PostGIS":
        return {'type': "PostGIS",
                'dbname': "distal",
                'table': "countries",
                'user': POSTGIS_USERNAME,
                'password' : POSTGIS_PASSWORD}
    elif DB_TYPE == "SpatiaLite":
        return {'type': "SQLite",
                'file': SPATIALITE_DBNAME,
                'table': "countries",
                'geometry_field' : "outline",
                'key_field': "id"}
MySQL 使用所谓的“虚拟数据源”,这是一种特殊文件,告诉 Mapnik 如何访问数据。我们在需要时创建这个文件,并根据需要将用户名和其他详细信息存储到该文件中。
备注
请注意,我们将 countries.vrt 文件存储在与 CGI 脚本相同的目录中。这样可以更容易地从 Mapnik 访问此文件。
现在我们已经编写了 get_datasource() 函数,接下来是使用它。在 selectArea.py 脚本的末尾添加以下行:
datasource = database.get_country_datasource()
The data source tells the map generator how to access the underlying map data. How data sources work is beyond the scope of this chapter; for now, we are simply going to set up the required datasource dictionary and related files so that we can generate our map. Note that the contents of this dictionary will vary depending on which database you are using, as well as which table you are trying to access; in this case, we are trying to display selected features from the countries table. To handle this, we’ll create a new function within our database module to set up the data source for our particular database:
def get_country_datasource():
    if DB_TYPE == "MySQL":
        vrtFile = os.path.join(os.path.dirname(__file__),
                            "countries.vrt")

        f = file(vrtFile, "w")
        f.write('<OGRVRTDataSource>\n')
        f.write(' <OGRVRTLayer name="countries">\n')
        f.write('   <SrcDataSource>MySQL:' + MYSQL_DBNAME)
        if MYSQL_USERNAME != None:
            f.write(",user=" + MYSQL_USERNAME)
        if MYSQL_PASSWORD != None:
            f.write(",passwd=" + MYSQL_PASSWORD)
        f.write('</SrcDataSource>\n')
        f.write('   <SrcSQL>SELECT id,outline ' +
                    'FROM countries</SrcSQL>\n')
        f.write(' </OGRVRTLayer>\n')
        f.write('</OGRVRTDataSource>\n')
        f.close()

        return {'type' : "OGR",
                'file' : vrtFile,
                'layer' : "countries"}

    elif DB_TYPE == "PostGIS":
        return {'type': "PostGIS",
                'dbname': "distal",
                'table': "countries",
                'user': POSTGIS_USERNAME,
                'password' : POSTGIS_PASSWORD}
    elif DB_TYPE == "SpatiaLite":
        return {'type': "SQLite",
                'file': SPATIALITE_DBNAME,
                'table': "countries",
                'geometry_field' : "outline",
                'key_field': "id"}
MySQL uses what is called a “virtual datasource”, which is a special file that tells Mapnik how to access the data. We create this file as we need it, storing the username and other details into the file as required.
备注
Note that we are storing the countries.vrt file in the same directory as our CGI scripts. This makes it easier to access this file from Mapnik.
Now that we have written the get_datasource() function, it’s time to use it. Add the following line to the end of your selectArea.py script:
datasource = database.get_country_datasource()
渲染地图图像#
Rendering the map image
有了边界框、地图的尺寸和数据源的设置后,我们终于可以将地图渲染为图像文件了。这只需要一个函数调用,代码如下:
imgFile = mapGenerator.generateMap(datasource,
                                    minLong, minLat,
                                    maxLong, maxLat,
                                    mapWidth, mapHeight,
                                    "[id] = "+str(countryID))
请注意,我们的数据源已经设置为显示来自 countries 表的特征,并且 “[id] = “+str(countryID) 是一个“高亮表达式”,用于在地图上突出显示给定 ID 的国家。
mapGenerator.generateMap() 函数返回一个 PNG 格式的图像文件,其中包含生成的地图。该图像文件存储在一个临时目录中,并返回文件的相对路径。这样我们可以直接在 CGI 脚本中使用返回的 imgFile,如以下代码所示:
print 'Content-Type: text/html; charset=UTF-8\n\n'
print '<html>'
print '<head><title>Select Area</title></head>'
print '<body>'
print '<b>' + name + '</b>'
print '<p>'
print '<form method="POST" action="showResults.py">'
print 'Select all features within'
print '<input type="text" name="radius" value="10" size="2">'
print 'miles of a point.'
print '<p>'
print 'Click on the map to identify your starting point:'
print '<br>'
print '<input type="image" src="' + imgFile + '" ismap>'
print '<input type="hidden" name="countryID"'
print 'value="' + str(countryID) + '">'
print '<input type="hidden" name="mapWidth"'
print 'value="' + str(mapWidth) + '">'
print '<input type="hidden" name="mapHeight"'
print 'value="' + str(mapHeight) + '">'
print '</form>'
print '</body></html>'
备注
<input type=”hidden”> 行定义了“隐藏表单字段”,将信息传递给下一个 CGI 脚本。我们将在下一节讨论如何使用这些信息。
在这个 CGI 脚本中使用 <input type=”image” src=”…” ismap> 的有趣效果是使得地图变得可以点击:当用户点击图像时,包含的 HTML 表单将会提交,并带有两个额外的参数,分别是 x 和 y。这两个参数包含用户点击图像时的坐标。
这就完成了 selectArea.py 的 CGI 脚本。确保你已经在程序的开头添加了适当的“shebang”行,并使其可执行,如前面所述,以便它可以作为 CGI 脚本运行。
如果一切顺利,你应该能够在 Web 浏览器中输入以下网址:
http://127.0.0.1:8000/cgi-bin/selectCountry.py
选择一个国家,并在浏览器中显示该国的地图。如果你点击地图,你会收到一个 404 错误,表示最终的 CGI 脚本尚未编写。
With the bounding box, the map’s dimensions and the data source all set up, we are finally ready to render the map into an image file. This is done using a single function call as follows:
imgFile = mapGenerator.generateMap(datasource,
                                   minLong, minLat,
                                   maxLong, maxLat,
                                   mapWidth, mapHeight,
                                   "[id] = "+str(countryID))
Note that our datasource has been set up to display features from the countries table, and that the “[id] = “+str(countryID) is a “highlight expression” is used to visually highlight the country with the given ID.
The mapGenerator.generateMap() function returns a reference to a PNG-format image file containing the generated map. This image file is stored in a temporary directory, and the file’s relative pathname is returned to the caller. This allows us to use the returned imgFile directly within our CGI script, like this:
print 'Content-Type: text/html; charset=UTF-8\n\n'
print '<html>'
print '<head><title>Select Area</title></head>'
print '<body>'
print '<b>' + name + '</b>'
print '<p>'
print '<form method="POST" action="showResults.py">'
print 'Select all features within'
print '<input type="text" name="radius" value="10" size="2">'
print 'miles of a point.'
print '<p>'
print 'Click on the map to identify your starting point:'
print '<br>'
print '<input type="image" src="' + imgFile + '" ismap>'
print '<input type="hidden" name="countryID"'
print '
value="' + str(countryID) + '">'
print '<input type="hidden" name="mapWidth"'
print '
value="' + str(mapWidth) + '">'
print '<input type="hidden" name="mapHeight"'
print '
value="' + str(mapHeight) + '">'
print '</form>'
print '</body></html>'
备注
The <input type=”hidden”> lines define “hidden form fields” that pass information on to the next CGI script. We’ll discuss how this information is used in the next section.
The use of <input type=”image” src=”…” ismap> in this CGI script has the interesting effect of making the map clickable: when the user clicks on the image, the enclosing HTML form will be submitted with two extra parameters named x and y. These contain the coordinate within the image that the user clicked on.
This completes the selectArea.py CGI script. Make sure you added an appropriate “shebang” line to the start of your program and made it executable, as described earlier, so that it can run as a CGI script.
All going well, you should be able to point your web browser to:
http://127.0.0.1:8000/cgi-bin/selectCountry.py
Choose a country, and see a map of that country displayed within your web browser. If you click within the map, you’ll get a 404 error, indicating that the final CGI script hasn’t been written yet.
“显示结果”脚本#
The “show results” script
最终的CGI脚本是实际工作的地方。首先,创建你的 showResults.py 文件,并在文件中输入以下内容:
#!/usr/bin/env python

import cgi
import pyproj

import database
import mapGenerator

############################################################

MAX_WIDTH = 1000
MAX_HEIGHT = 800
METERS_PER_MILE = 1609.344

############################################################

database.open()
备注
别忘了将此文件标记为可执行文件,这样它就可以作为CGI脚本运行了。你可以使用 chmod 命令来完成此操作,正如本章前面“什么是CGI脚本?”部分中所描述的那样。
在此脚本中,我们将获取用户点击的 (x, y) 坐标,以及输入的搜索半径,将 (x, y) 坐标转换为经度和纬度,并识别出该搜索半径内的所有地名。然后,我们生成一个高分辨率的地图,显示搜索半径内的海岸线和地名,并将该地图展示给用户。
备注
请记住,x 对应的是经度值,y 对应的是纬度值。
(x, y) 等于 (经度, 纬度),而不是 (纬度, 经度)。
接下来我们逐步分析这些步骤。
The final CGI script is where the real work is done. Start by creating your showResults.py file, and type the following into this file:
#!/usr/bin/env python

import cgi
import pyproj

import database
import mapGenerator

############################################################

MAX_WIDTH = 1000
MAX_HEIGHT = 800
METERS_PER_MILE = 1609.344

############################################################

database.open()
备注
Don’t forget to mark this file as executable so that it can be run as a CGI script. You can do this using the chmod command, as described in the What is a CGI script? section earlier in this chapter.
In this script, we will take the (x, y) coordinate the user clicked on, along with the entered search radius, convert the (x, y) coordinate into a longitude and latitude, and identify all the place names within that search radius. We then generate a high-resolution map showing the shorelines and place names within the search radius, and display that map to the user.
备注
Remember that x corresponds to a longitude value, and y to a latitude value.
(x, y) equals (longitude, latitude), not (latitude, longitude).
Let’s examine each of these steps in turn.
识别点击点#
Identifying the clicked-on point
selectArea.py 脚本生成了一个 HTML 表单,当用户点击低分辨率的国家地图时,该表单会被提交。showResults.py 脚本接收表单参数,包括用户点击的点的 x 和 y 坐标。
单独来看,这个坐标并没有太大用处。它只是用户点击的点的 x 和 y 偏移量,单位是像素。我们需要将提交的 (x, y) 像素坐标转换为对应于地球表面被点击点的经纬度值。
为此,我们需要以下信息:
地图的地理坐标范围:minLong, minLat, maxLong, 和 maxLat
地图的尺寸(像素):mapWidth 和 mapHeight
这些变量都在前一节中计算过,并通过隐藏的表单变量传递给我们,同时还包括国家 ID、所需的搜索半径和点击点的 (x, y) 坐标。我们可以使用 cgi 模块来检索这些信息;将以下代码添加到 showResults.py 文件的末尾:
form = cgi.FieldStorage()
countryID = int(form['countryID'].value)
radius    = int(form['radius'].value)
x         = int(form['x'].value)
y         = int(form['y'].value)

mapWidth  = int(form['mapWidth'].value)
mapHeight = int(form['mapHeight'].value)
有了这些信息,我们现在可以计算出用户点击的经纬度。为此,我们首先必须计算用于生成用户点击的地图的边界。将以下代码添加到 showResults.py 文件的末尾:
details = database.get_country_details(countryID)
envelope = shapely.wkt.loads(details['bounds_wkt'])
minLong,minLat,maxLong,maxLat = envelope.bounds
minLong = minLong - 0.2
minLat = minLat - 0.2
maxLong = maxLong + 0.2
maxLat = maxLat + 0.2
现在,我们可以计算用户点击的确切经纬度。我们首先计算用户点击的图像上横向偏移的距离,得到一个从 0 到 1 的数值:
xFract = float(x)/float(mapWidth)
xFract 值为 0.0 对应图像的左侧,而 xFract 值为 1.0 对应图像的右侧。然后,我们将此值与最小和最大经度值结合起来,计算被点击点的经度:
longitude = minLong + xFract * (maxLong-minLong)
然后,我们对 Y 坐标执行相同的操作,将其转换为纬度值:
yFract = float(y)/float(mapHeight)
latitude = minLat + (1-yFract) * (maxLat-minLat)
请注意,在上面的计算中我们使用了 (1-yFract) 而不是 yFract。这是因为 minLat 值对应的是图像底部的纬度,而 yFract 值为 0.0 时对应的是图像的顶部。通过使用 (1-yFract),我们将值垂直翻转,以便正确计算纬度。
The selectArea.py script generates an HTML form that is submitted when the user clicks on the low-resolution country map. The showResults.py script receives the form parameters, including the x and y coordinates of the point the user clicked on.
By itself, this coordinate isn’t very useful. It’s simply the x and y offset, measured in pixels, of the point the user clicked on. We need to translate the submitted (x, y) pixel coordinate into a latitude and longitude value corresponding to the clicked-on point on the Earth’s surface.
To do this, we need to have the following information:
The map’s bounding box in geographic coordinates: minLong, minLat, maxLong, and maxLat
The map’s size in pixels: mapWidth and mapHeight
These variables were all calculated in the previous section and passed to us using hidden form variables, along with the country ID, the desired search radius, and the (x, y) coordinate of the clicked on point. We can retrieve all of these using the cgi module; add the following code to the end of your showResults.py file:
form = cgi.FieldStorage()
countryID = int(form['countryID'].value)
radius    = int(form['radius'].value)
x         = int(form['x'].value)
y         = int(form['y'].value)

mapWidth  = int(form['mapWidth'].value)
mapHeight = int(form['mapHeight'].value)
With this information, we can now calculate the latitude and longitude that the user clicked on. To do this, we first have to calculate the bounds that were used to generate the map that the user clicked on. Add the following code to the end of your showResults.py file:
details = database.get_country_details(countryID)
envelope = shapely.wkt.loads(details['bounds_wkt'])
minLong,minLat,maxLong,maxLat = envelope.bounds
minLong = minLong - 0.2
minLat = minLat - 0.2
maxLong = maxLong + 0.2
maxLat = maxLat + 0.2
We can now calculate the exact latitude and longitude the user clicked on. We start by calculating how far across the image the user clicked, as a number in the range from 0 to 1:
xFract = float(x)/float(mapWidth)
An xFract value of 0.0 corresponds to the left side of the image, while an xFract value of 1.0 corresponds to the right side of the image. We then combine this with the minimum and maximum longitude values to calculate the longitude of the clicked-on point:
longitude = minLong + xFract * (maxLong-minLong)
We then do the same to convert the Y coordinate into a latitude value:
yFract = float(y)/float(mapHeight)
latitude = minLat + (1-yFract) * (maxLat-minLat)
Note that we are using (1-yFract) rather than yFract in the preceding calculation. This is because the minLat value refers to the latitude of the bottom of the image, while a yFract value of 0.0 corresponds to the top of the image. By using (1-yFract), we flip the values vertically so that the latitude is calculated correctly.
按距离识别特征#
Identifying features by distance
让我们回顾一下目前为止所取得的进展。用户已经选择了一个国家,查看了该国轮廓的简单地图,输入了所需的搜索半径,并点击地图上的一个点来确定搜索的起点。然后,我们将这个点击的点转换为经纬度值。
所有这些为我们提供了三个数字:所需的搜索半径,以及用于开始搜索的起点的纬度/经度坐标。
我们现在的任务是确定哪些特征位于点击点给定的搜索半径内:
因为搜索半径是以实际距离(英里)指定的,所以我们需要能够精确地计算距离。在第二章《GIS》中,我们讨论了解决这个问题的一种方法—— 大圆距离 的概念:
给定起点和终点,大圆距离的计算告诉我们两点之间沿地球表面的距离。
为了确定匹配的特征,我们需要某种方式找出所有大圆距离小于或等于所需搜索半径的匹配地名。让我们看看我们可能采取的一些方法来识别这些特征。
Let’s review what we have achieved so far. The user has selected a country, viewed a simple map of the country’s outline, entered a desired search radius, and clicked on a point on the map to identify the origin for the search. We have then converted this clicked-on point into a latitude and longitude value.
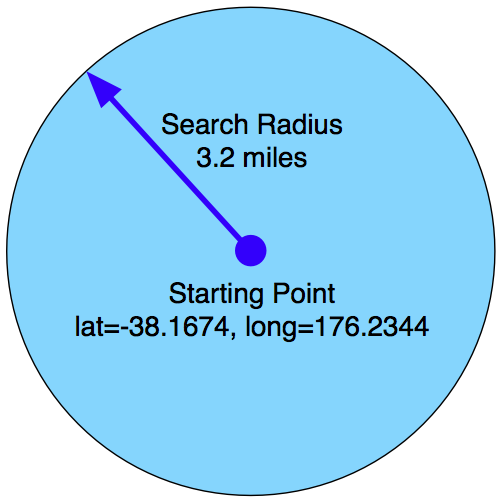
All of this provides us with three numbers: the desired search radius, and the lat/ long coordinates for the point at which to start the search. Our task now is to identify which features are within the given search radius of the clicked-on point:
Because the search radius is specified as an actual distance in miles, we need to be able to calculate distances accurately. We looked at an approach to solving this problem in Chapter 2, GIS, where we considered the concept of a great circle distance:
Given a start and end point, the great circle distance calculation tells us the distance along the Earth’s surface between the two points.
In order to identify the matching features, we need to somehow find all the matching place names which have a great circle distance less than or equal to the desired search radius. Let’s look at some ways in which we could possibly identify these features.
手动计算距离#
Calculating distances manually
正如我们在第五章《在Python中处理地理空间数据》中看到的,pyproj 允许我们基于两个经纬度坐标进行精确的大圆距离计算,方法如下:
geod = pyproj.Geod(ellps='WGS84')
angle1, angle2, distance = geod.inv(long1, lat1, long2, lat2)
计算结果中的距离单位是米,我们可以很容易地将其转换为英里,如下所示:
miles = distance / 1609.344
基于此,我们可以编写一些代码来查找在所需搜索半径内的特征:
geod = pyproj.Geod(ellps="WGS84")

cursor.execute("select id, X(position), Y(position) " +
                "from places")

for id, long, lat in cursor:
    angle1, angle2, distance = geod.inv(startLong, startLat, long, lat)
    if distance / 1609.344 <= searchRadius:
        ...
这样肯定可以工作,并返回在给定搜索半径内的所有特征的准确列表。问题在于速度;因为我们的 places 表中有超过四百万个特征,所以这个程序会花费几分钟时间来识别所有匹配的地名。显然,这不是一个非常实际的解决方案。
As we saw in Chapter 5, Working with Geospatial Data in Python, pyproj allows us to do accurate great circle distance calculations based on two lat/long coordinates, like this:
geod = pyproj.Geod(ellps='WGS84')
angle1,angle2,distance = geod.inv(long1, lat1,
                                  long2, lat2)
The resulting distance is in meters, and we could easily convert this to miles as follows:
miles = distance / 1609.344
Based on this, we could write some code to find the features within the desired search radius:
geod = pyproj.Geod(ellps="WGS84")

cursor.execute("select id,X(position),Y(position) " +
               "from places")

for id,long,lat in cursor:
    angle1,angle2,distance = geod.inv(startLong, startLat,
                                      long, lat)
    if distance / 1609.344 <= searchRadius:
        ...
This would certainly work, and would return an accurate list of all features within the given search radius. The problem is speed; because there are more than four million features in our places table, this program would take several minutes to identify all the matching place names. Obviously this isn’t a very practical solution.
使用角距离#
Using angular distances
我们在 第五章《在Python中处理地理空间数据》 中看到了另一种通过距离识别特征的方法,在那一章中,我们查找了城市区域内或附近的所有公园。在那一章中,我们使用了**角距离**来估算两个点之间的距离。角距离是以度为单位的距离——从技术上讲,它是从地球中心出发的两条射线之间的夹角,这两条射线分别指向地球表面的两个目标点。因为纬度和经度值都是角度测量,所以我们可以基于两个经纬度值像这样轻松计算角距离:
distance = math.sqrt((long2-long1)**2) + (lat2-lat1)**2)
这是一种简单的笛卡尔距离计算方法。我们天真地把纬度和经度值当作笛卡尔坐标来处理。虽然这样做是不正确的,但它的确给了我们某种形式的距离测量。
那么这种角距离测量给了我们什么呢?我们知道,角距离越大,实际的(大圆)距离也越大。在 第五章《在Python中处理地理空间数据》 中,我们用这个方法来查找位于加利福尼亚的所有公园,这些公园大约在城市区域十公里以内。然而,在那一章中,我们能够使用这种方法是因为我们只处理了加利福尼亚的数据。实际上,角距离会根据纬度的不同而有很大差异;如果你当前的位置在赤道附近,查找在经度±1度范围内的点将包含111公里的所有点;如果你处于±30度纬度处,则为100公里;在±60度纬度时,只有55公里;而在极地,则为零公里:
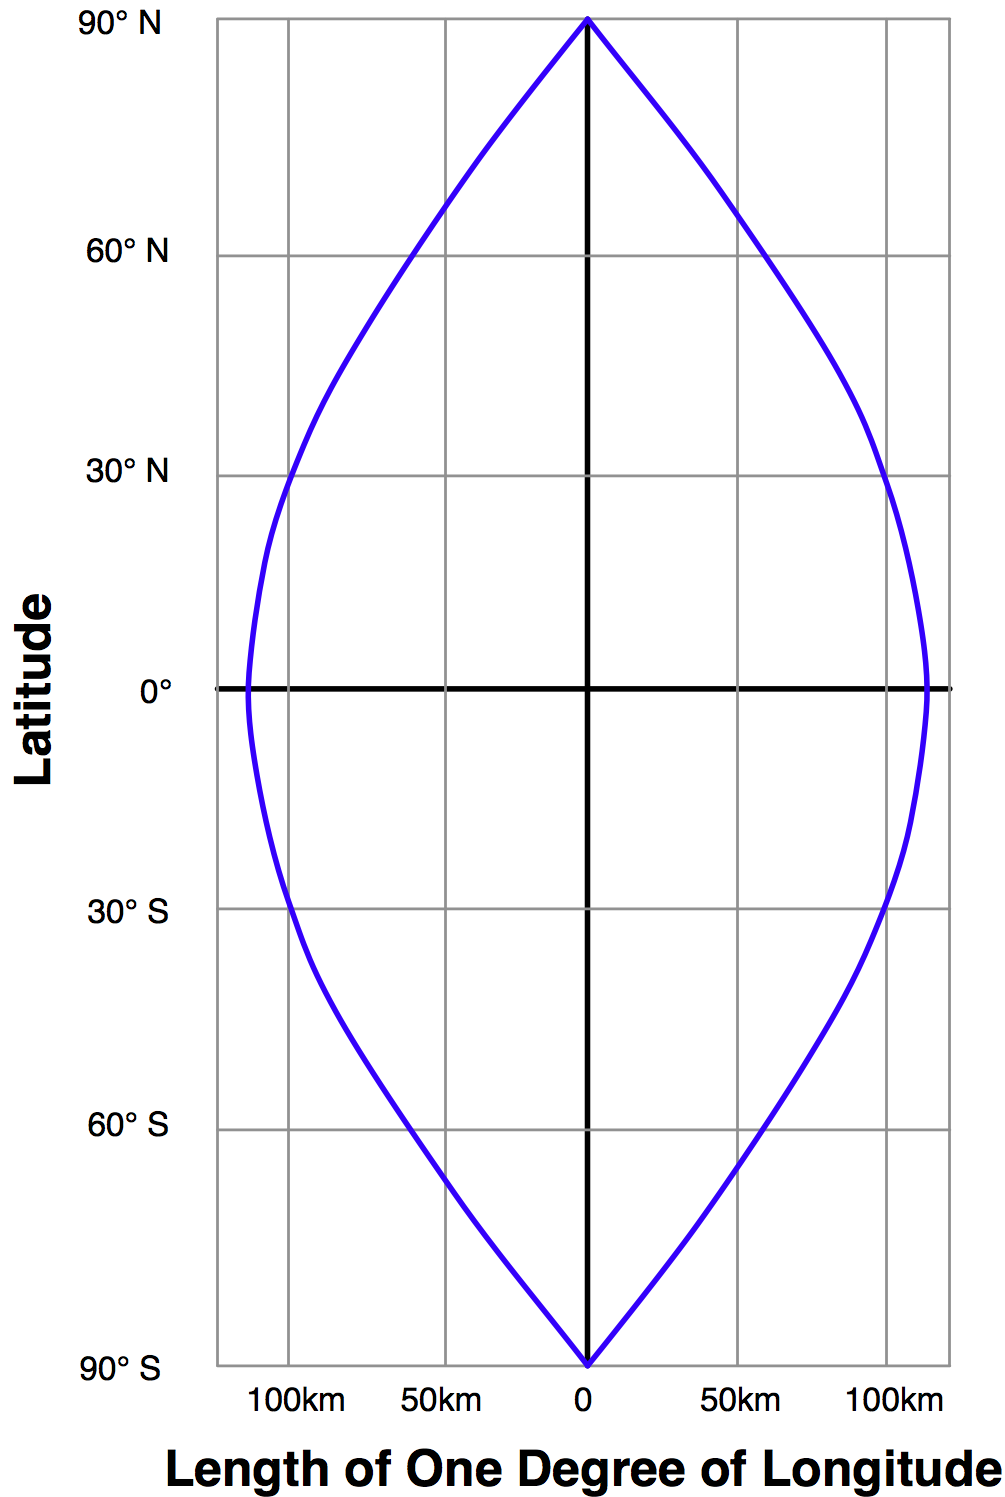
由于DISTAL包含了全球数据,因此角度测量几乎是没用的——我们无法假设给定的纬度和经度差异会等于地球表面上的某一距离,这对我们进行基于距离的搜索是无帮助的。
We saw an alternative way of identifying features by distance in Chapter 5, Working with Geospatial Data in Python, where we looked for all parks in or near an urban area. In that chapter, we used an angular distance to estimate how far apart two points were. An angular distance is a distance measured in degrees—technically, it is the angle between two rays going out from the center of the Earth through the two desired points on the Earth’s surface. Because latitude and longitude values are angular measurements, we can easily calculate an angular distance based on two lat/long values like this:
distance = math.sqrt((long2-long1)**2) + (lat2-lat1)**2)
This is a simple Cartesian distance calculation. We are naively treating lat/long values as if they were Cartesian coordinates. This isn’t right, but it does give us a distance measurement of sorts.
So what does this angular distance measurement give us? We know that the bigger the angular distance, the bigger the real (great circle) distance will be. In Chapter 5, Working with Geospatial Data in Python, we used this to identify all parks in California which where approximately within ten kilometers of an urban area. However, we could get away with this in that chapter because we were only dealing with data for California. In reality, the angular distance varies greatly depending on which latitude you are dealing with; looking for points within ±1 degree of longitude of your current location will include all points within 111 km if you are at the equator, 100 km if you are at ±30 degree latitude, 55 km at ±60 degree, and zero km at the poles:
Because DISTAL includes data for the entire world, angular measurements would be all but useless—we can’t assume that a given difference in latitude and longitude values would equal a given distance across the Earth’s surface in any way which would help us do the distance-based searching.
使用投影坐标#
Using projected coordinates
另一种查找给定距离内所有点的方法是使用投影坐标系统,该系统准确地表示坐标值之间的距离差异。例如, 统一横轴墨卡托(UTM)投影 定义了Y坐标为相对于赤道的南北距离(单位:米),X坐标为相对于某一参考点的东西距离(单位:米)。使用UTM投影,可以通过笛卡尔距离公式轻松地找出给定距离内的所有点:
distance = math.sqrt((long2-long1)**2) + (lat2-lat1)**2)
if distance < searchRadius:
......
不幸的是,像UTM这样的投影坐标系统仅对覆盖地球表面小部分区域的数据准确。UTM坐标系统实际上是多个不同的投影,将世界划分为六十个不同的“区”,每个区宽六度经度。你需要使用与你的特定数据相对应的正确UTM区:例如,加利福尼亚的坐标属于UTM第10区,尝试将它们投影到UTM第20区将导致距离测量非常不准确。
如果你有的数据仅覆盖地球表面的一小块区域,使用投影坐标系统将有很大优势。你不仅可以使用笛卡尔坐标计算距离,还可以利用数据库函数,如PostGIS的 ST_DWithin() 函数,快速找到距离某个中心点给定物理距离内的所有点。
然而,不幸的是, DISTAL 应用程序使用的数据覆盖了整个地球。因此,我们无法为这个应用程序使用投影坐标,而必须寻找其他方式来解决这个问题。
备注
当然, DISTAL 应用程序是故意设计为包含全球数据的,正是出于这个原因。若能使用单一的UTM区来处理所有数据,那将是太过于方便了。
事实上,DISTAL可以使用投影UTM坐标,但这非常复杂。因为每个数据库表中的每个特征都必须具有相同的空间参考,所以不可能在一个表中存储属于不同UTM区的特征——我们能够在UTM投影中存储全球数据的唯一方式是为每个UTM区创建一个单独的数据库表。
这将需要六十个单独的数据库表!要识别给定距离内的点,你首先需要弄清楚起始点位于哪个UTM区,然后检查该数据库表中的特征。你还必须处理超出单个UTM区边界的搜索。
不言而喻,这种方法对于我们来说过于复杂。它确实能工作(并且比任何其他方法都具有更好的可扩展性),但由于其复杂性,我们不考虑使用它。
Another way of finding all points within a given distance is to use a projected coordinate system that accurately represents distance as differences between coordinate values. For example, the Universal Transverse Mercator projection defines Y coordinates as a number of meters north or south of the equator, and X coordinates as a number of meters east or west of a given reference point. Using the UTM projection, it would be easy to identify all points within a given distance by using the Cartesian distance formula:
distance = math.sqrt((long2-long1)**2) + (lat2-lat1)**2)
if distance < searchRadius:
......
Unfortunately, projected coordinate systems such as UTM are only accurate for data that covers a small portion of the Earth’s surface. The UTM coordinate system is actually a large number of different projections, dividing the world up into sixty separate “zones” each six degrees of longitude wide. You need to use the correct UTM zone for your particular data: California’s coordinates belong in UTM zone 10, and attempting to project them into UTM zone 20 would cause your distance measurements to be very inaccurate.
If you had data that covered only a small area of the Earth’s surface, using a projected coordinate system would have great advantages. Not only could you calculate distances using Cartesian coordinates, you could also make use of database functions such as PostGIS’s ST_DWithin() function to quickly find all points within a given physical distance of a central point.
Unfortunately, the DISTAL application makes use of data covering the entire Earth. For this reason, we can’t use projected coordinates for this application, and have to find some other way of solving this problem.
备注
Of course, the DISTAL application was deliberately designed to include world-wide data, for precisely this reason. Being able to use a single UTM zone for all the data would be too convenient.
Actually, there is a way in which DISTAL could use projected UTM coordinates, but it’s rather complicated. Because every feature in a given database table has to have the same spatial reference, it isn’t possible to have different features in a table belonging to different UTM zones—the only way we could store worldwide data in UTM projections would be to have a separate database table for each UTM zone.
This would require sixty separate database tables! To identify the points within a given distance, you would first have to figure out which UTM zone the starting point was in, and then check the features within that database table. You would also have to deal with searches that extend out beyond the edge of a single UTM zone.
Needless to say, this approach is far too complex for us. It would work (and would scale better than any of the alternatives) but we won’t consider it because of its complexity.
混合方法#
A hybrid approach
在第6章《数据库中的GIS》中,我们讨论了识别位于给定多边形内的所有点的过程。由于MySQL仅处理边界框交集测试,我们最终不得不编写一个程序,要求数据库识别所有位于边界框内的点,然后手动检查每个点是否实际位于多边形内:
这为我们解决 DISTAL 的基于距离选择问题提供了一种思路:我们可以计算一个包含所需搜索半径的边界框,要求数据库识别所有位于该边界框内的点,然后计算所有返回点的 大圆距离 ,仅选择实际位于搜索半径内的点。由于实际位于边界框内的点相对较少,仅计算这些点的 大圆距离 会很快,这使我们能够在没有较大性能损失的情况下准确地找到匹配的点。
让我们从计算边界框开始。我们已经知道起始点的坐标和所需的搜索半径:
使用 pyproj ,我们可以通过在起始点的正北、正南、正东和正西方向各自移动半径米来计算四个点的纬度/经度坐标:
然后,我们使用这四个点来定义包含所需搜索半径的边界框:

我们将在数据库模块中创建一个新函数,使用这个边界框进行空间搜索。让我们首先将以下内容添加到你的 database.py 模块的末尾:
def find_places_within(startLat, startLong, searchRadius):
    global _cursor

    if DB_TYPE == "MySQL":
        ...
    elif DB_TYPE == "PostGIS":
        ...
    elif DB_TYPE == "SpatiaLite":
        ...
请注意,由于我们使用 pyproj 执行前向大地测量计算,我们可以计算出边界框的正确纬度/经度坐标,而不受起始点纬度的影响。唯一可能失败的情况是,当 startLat 在距离北极或南极 searchRadius 米内时——考虑到我们正在搜索城市,这种情况几乎不可能发生(我们也可以始终添加错误检查代码来捕捉这种情况)。
当完成时,我们的 find_places_within() 函数将返回所有位于给定边界框内的地点,以及计算出的边界框。由于每个数据库的空间查询不同,我们将分别查看每个数据库。
对于MySQL,我们将使用提供的边界框创建一个多边形,然后使用 MBRContains() 函数搜索该多边形内的地点。为此,将第一个 … 替换为以下代码:
p = Polygon([(minLong, minLat), (maxLong, minLat),
    (maxLong, maxLat), (minLong, maxLat),
    (minLong, minLat)])
wkt = shapely.wkt.dumps(p)
_cursor.execute("SELECT name," +
                "X(position),Y(position) " +
                "FROM places WHERE MBRContains(" +
                "GeomFromText(%s), position)", (wkt,))
PostGIS采用类似的方法,创建一个多边形,然后使用 ST_CONTAINS() 函数来识别匹配的地点:
p = Polygon([(minLong, minLat), (maxLong, minLat),
                (maxLong, maxLat), (minLong, maxLat),
                (minLong, minLat)])
wkt = shapely.wkt.dumps(p)
_cursor.execute("SELECT name," +
                "ST_X(position),ST_Y(position) " +
                "FROM places WHERE ST_CONTAINS(" +
                "ST_GeomFromText(%s, 4326), " +
    "position)", (wkt,))
备注
你可能会想知道为什么我们不使用PostGIS的 ST_DWITHIN() 函数来识别匹配的地点。问题在于我们使用的是未投影的坐标,这意味着传递给 ST_DWITHIN() 的“距离”必须以度数而不是米为单位。这是可行的,但需要进行一些复杂的计算才能从米转换为度数。为了保持简单,我们将使用 ST_CONTAINS() 函数。
最后,对于 SpatiaLite ,我们需要做更多的工作。请记住, SpatiaLite 不会自动为查询使用空间索引。为了使这段代码在 SpatiaLite 中高效运行,我们必须直接检查空间索引:
_cursor.execute("SELECT name," +
                "X(position),Y(position) " +
                "FROM places WHERE id in " +
                "(SELECT pkid " +
                "FROM idx_places_position " +
                "WHERE xmin >= ? AND xmax <= ? " +
                "AND ymin >= ? and ymax <= ?)",
                (minLong, maxLong, minLat, maxLat))
现在,我们已经执行了一个SQL查询,识别了所有位于边界框内的点,接下来我们可以检查 大圆距离 并丢弃那些位于边界框内但在搜索半径之外的点。为此,在 find_places_within() 函数的末尾添加以下内容:
places = [] # List of (long, lat, name) tuples.

geod = pyproj.Geod(ellps="WGS84")

for row in _cursor:
    name,long,lat = row
    angle1,angle2,distance = geod.inv(startLong, startLat,
                                        long, lat)
    if distance > searchRadius: continue

    places.append([long, lat, name])

return {'places' : places,
        'minLat' : minLat,
        'minLong' : minLong,
        'maxLat' : maxLat,
        'maxLong' : maxLong }
正如你所看到的,我们返回了匹配地点的列表,以及我们计算出的最小和最大纬度与经度值。
这完成了我们的 find_places_within() 函数,它实现了一个百分之百准确的基于距离的地点名称查找,并且计算结果只需要几毫秒的时间。
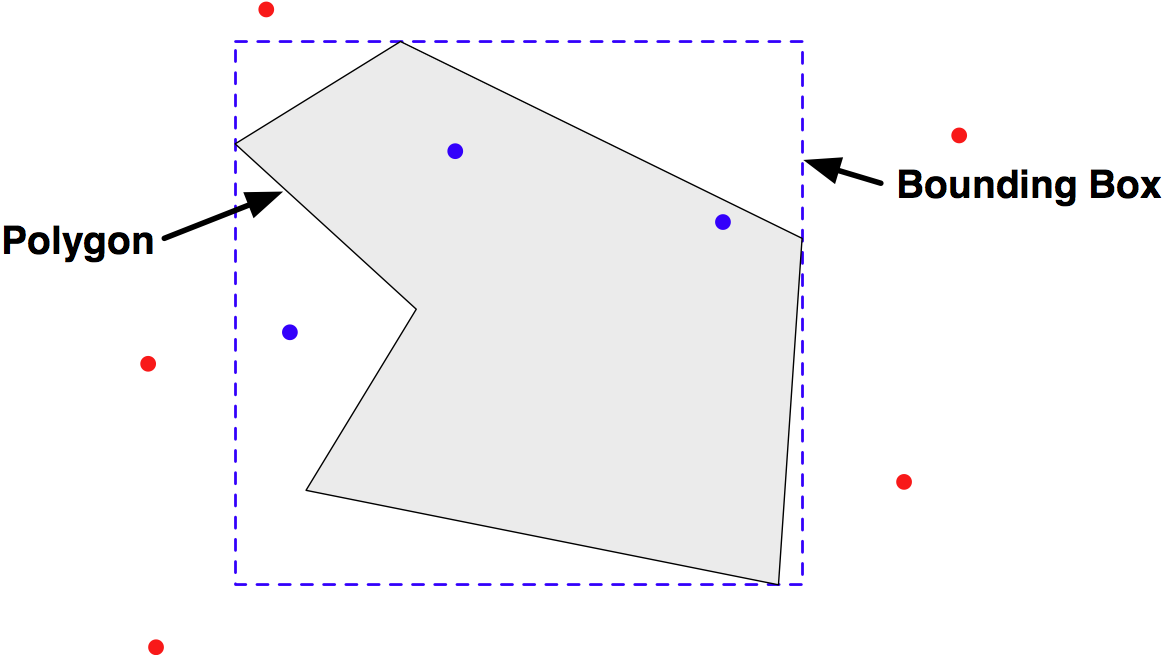
In Chapter 6, GIS in the Database, we looked at the process of identifying all points within a given polygon. Because MySQL only handles bounding-box intersection tests, we ended up having to write a program which asked the database to identify all points within the bounding box, and then manually checked each point to see if it was actually inside the polygon:
This suggests a way in which we can solve the distance-based-selection problem for DISTAL: we can calculate a bounding box which encloses the desired search radius, ask the database to identify all points within that bounding box, and then calculate the great circle distance for all the returned points, selecting just those points that are actually inside the search radius. Because a relatively small number of points will be inside the bounding box, calculating the great circle distance for just these points will be quick, allowing us to accurately find the matching points without a large performance penalty.
Let’s start by calculating the bounding box. We already know the coordinates for the starting point and the desired search radius:
Using pyproj, we can calculate the lat/long coordinates for four points by traveling radius meters directly north, south, east, and west of the starting point:
We then use these four points to define the bounding box that encloses the desired search radius:
We’re going to create a new function within our database module, which performs a spatial search using this bounding box. Let’s start by adding the following to the end of your database.py module:
def find_places_within(startLat, startLong, searchRadius):
    global _cursor

    if DB_TYPE == "MySQL":
        ...
    elif DB_TYPE == "PostGIS":
        ...
    elif DB_TYPE == "SpatiaLite":
        ...
Note that, because we’re using pyproj to do a forward geodetic calculation, we can calculate the correct lat/long coordinates for the bounding box regardless of the latitude of the starting point. The only place this will fail is if startLat is within searchRadius meters of the North or South Pole—which is highly unlikely given that we’re searching for cities (and we could always add error-checking code to catch this).
When it’s finished, our find_places_within() function will return a list of all the places within the given bounding box, as well as the calculated bounding box. Because the spatial queries are different for each database, we’ll look at each one individually.
For MySQL, we’ll create a Polygon out of the supplied bounding box, and then use the MBRContains() function to search for places within that Polygon. To do this, replace the first … with the following code:
p = Polygon([(minLong, minLat), (maxLong, minLat),
    (maxLong, maxLat), (minLong, maxLat),
    (minLong, minLat)])
wkt = shapely.wkt.dumps(p)
_cursor.execute("SELECT name," +
                "X(position),Y(position) " +
                "FROM places WHERE MBRContains(" +
                "GeomFromText(%s), position)", (wkt,))
PostGIS uses a similar approach, creating a Polygon and then using the ST_CONTAINS() function to identify the matching places:
p = Polygon([(minLong, minLat), (maxLong, minLat),
             (maxLong, maxLat), (minLong, maxLat),
             (minLong, minLat)])
wkt = shapely.wkt.dumps(p)
_cursor.execute("SELECT name," +
                "ST_X(position),ST_Y(position) " +
                "FROM places WHERE ST_CONTAINS(" +
                "ST_GeomFromText(%s, 4326), " +
    "position)", (wkt,))
备注
You might be wondering why we don’t use PostGIS’s ST_DWITHIN() function to identify the matching places. The problem is that we are using unprojected coordinates, which means that the “distance” supplied to ST_DWITHIN() would have to be in measured in degrees rather than meters. This is possible, but there are some tricky calculations required to convert from meters to degrees. To keep things simple, we’ll use the ST_CONTAINS() function instead.
Finally, for SpatiaLite we have to do a bit more work. Remember that SpatiaLite doesn’t automatically use a spatial index for queries. To make this code efficient in SpatiaLite, we have to check the spatial index directly:
_cursor.execute("SELECT name," +
                "X(position),Y(position) " +
                "FROM places WHERE id in " +
                "(SELECT pkid " +
                "FROM idx_places_position " +
                "WHERE xmin >= ? AND xmax <= ? " +
                "AND ymin >= ? and ymax <= ?)",
                (minLong, maxLong, minLat, maxLat))
Now that we have executed an SQL query to identify all the points within the bounding box, we can check the great circle distance and discard those points, which are inside the bounding box, but outside the search radius. To do this, add the following to the end of your find_places_within() function:
places = [] # List of (long, lat, name) tuples.

geod = pyproj.Geod(ellps="WGS84")

for row in _cursor:
    name,long,lat = row
    angle1,angle2,distance = geod.inv(startLong, startLat,
                                      long, lat)
    if distance > searchRadius: continue

    places.append([long, lat, name])

return {'places' : places,
        'minLat' : minLat,
        'minLong' : minLong,
        'maxLat' : maxLat,
        'maxLong' : maxLong }
As you can see, we return the list of matching places, along with the minimum and maximum latitude and longitude values we calculated.
This completes our find_places_within() function, which achieves a 100 percent accurate distance-based lookup on place names, with the results taking only a fraction of a second to calculate.
显示结果#
Displaying the results
现在,我们已经计算出了位于所需搜索半径内的地点名称列表,我们可以使用 mapGenerator.py 模块来显示它们。然而,在此之前,我们需要设置一个数据源来显示高分辨率的海岸线。让我们向我们的 database.py 模块添加另一个函数来完成这一任务:
def get_shoreline_datasource():
    if DB_TYPE == "MySQL":

        vrtFile = os.path.join(os.path.dirname(__file__),
                                "shorelines.vrt")
        f = file(vrtFile, "w")
        f.write('<OGRVRTDataSource>\n')
        f.write(' <OGRVRTLayer name="shorelines">\n')
        f.write('
        <SrcDataSource>MYSQL:' + MYSQL_DBNAME)
        if MYSQL_USERNAME not in ["", None]:
            f.write(",user=" + MYSQL_USERNAME)
        if MYSQL_PASSWORD not in ["", None]:
            f.write(",passwd=" + MYSQL_PASSWORD)
        f.write(',tables=shorelines</SrcDataSource>\n')
        f.write('   <SrcSQL>\n')
        f.write('     SELECT id,outline FROM shorelines ' +
                                        'WHERE level=1\n')
        f.write('     </SrcSQL>\n')
        f.write(' </OGRVRTLayer>\n')
        f.write('</OGRVRTDataSource>\n')
        f.close()

        return {'type' : "OGR",
                'file' : vrtFile,
                'layer' : "shorelines"}
    elif DB_TYPE == "PostGIS":
        return {'type': "PostGIS",
                'dbname': "distal",
                'table': "shorelines",
                'user': POSTGIS_USERNAME,
                'password' : POSTGIS_PASSWORD}
    elif DB_TYPE == "SpatiaLite":
        return {'type': "SQLite",
                'file': SPATIALITE_DBNAME,
                'table': "shorelines",
                'geometry_field' : "outline",
                'key_field': "id"}
如你所见,这个函数几乎与我们的 get_country_datasource() 函数相同,只是它访问了不同的数据库表格,用于显示高分辨率的海岸线,而不是低分辨率的国家轮廓。
备注
请注意,我们在.VRT文件中的 SrcSQL 语句只包括`level`等于1的海岸线数据。这意味着我们仅显示海岸线,而不包括湖泊、湖中的岛屿等。由于 mapGenerator.py 模块不支持多个数据源,因此我们在此版本的 DISTAL 系统中无法绘制湖泊。扩展 mapGenerator.py 以支持多个数据源是可能的,但对于这一章来说过于复杂。目前,我们只能接受这个限制。
设置完成后,我们终于可以回到 showResults.py 文件,使用它来显示我们的结果:
results = database.find_places_within(latitude, longitude,
                                        radius)

imgFile = mapGenerator.generateMap(datasource,
                                    minLong, minLat,
                                    maxLong, maxLat,
                                    600, 600,
                                    points=results['places'])
在我们之前调用地图生成器时,我们使用了一个筛选表达式来突出显示特定的特征。在这个例子中,我们不需要突出显示任何东西。相反,我们将地点名称列表传递给它,作为关键字参数 points 。
地图生成器创建一个PNG格式的文件,并返回对该文件的引用,我们可以将其展示给用户:
print 'Content-Type: text/html; charset=UTF-8\n\n'
print '<html>'
print '<head><title>Search Results</title></head>'
print '<body>'
print '<b>' + countryName + '</b>'
print '<p>'
print '<img src="' + imgFile + '">'
print '</body>'
print '</html>'
这完成了我们第一个版本的 showResults.py CGI脚本。
Now that we have calculated the list of place names within the desired search radius, we can use the mapGenerator.py module to display them. Before we do so, though, we’ll have to set up a data source to display the high-resolution shorelines. Let’s add another function to our database.py module, which does this:
def get_shoreline_datasource():
    if DB_TYPE == "MySQL":

        vrtFile = os.path.join(os.path.dirname(__file__),
                               "shorelines.vrt")
        f = file(vrtFile, "w")
        f.write('<OGRVRTDataSource>\n')
        f.write(' <OGRVRTLayer name="shorelines">\n')
        f.write('
        <SrcDataSource>MYSQL:' + MYSQL_DBNAME)
        if MYSQL_USERNAME not in ["", None]:
            f.write(",user=" + MYSQL_USERNAME)
        if MYSQL_PASSWORD not in ["", None]:
            f.write(",passwd=" + MYSQL_PASSWORD)
        f.write(',tables=shorelines</SrcDataSource>\n')
        f.write('   <SrcSQL>\n')
        f.write('     SELECT id,outline FROM shorelines ' +
                                        'WHERE level=1\n')
        f.write('     </SrcSQL>\n')
        f.write(' </OGRVRTLayer>\n')
        f.write('</OGRVRTDataSource>\n')
        f.close()

        return {'type' : "OGR",
                'file' : vrtFile,
                'layer' : "shorelines"}
    elif DB_TYPE == "PostGIS":
        return {'type': "PostGIS",
                'dbname': "distal",
                'table': "shorelines",
                'user': POSTGIS_USERNAME,
                'password' : POSTGIS_PASSWORD}
    elif DB_TYPE == "SpatiaLite":
        return {'type': "SQLite",
                'file': SPATIALITE_DBNAME,
                'table': "shorelines",
                'geometry_field' : "outline",
                'key_field': "id"}
As you can see, this is almost identical to our get_country_datasource() function, except that it accesses a different database table to display the high-resolution shoreline rather than the low-resolution country outlines.
备注
Notice that the SrcSQL statement in our .VRT file only includes shoreline data where level is equal 1. This means that we’re only displaying the coastlines, and not the lakes, islands-on-lakes, and so on. Because the mapGenerator.py module doesn’t support multiple data sources, we aren’t able to draw lakes in this version of the DISTAL system. Extending mapGenerator.py to support multiple data sources is possible, but is too complicated for this chapter. For now we’ll just have to live with this limitation.
With this in place, we can finally return to our showResults.py file and use it to display our results:
results = database.find_places_within(latitude, longitude,
                                      radius)

imgFile = mapGenerator.generateMap(datasource,
                                   minLong, minLat,
                                   maxLong, maxLat,
                                   600, 600,
                                   points=results['places'])
When we called the map generator previously, we used a filter expression to highlight particular features. In this case we don’t need to highlight anything. Instead, we pass it the list of place names to display on the map in the keyword parameter named points.
The map generator creates a PNG-format file, and returns a reference to that file which we can then display to the user:
print 'Content-Type: text/html; charset=UTF-8\n\n'
print '<html>'
print '<head><title>Search Results</title></head>'
print '<body>'
print '<b>' + countryName + '</b>'
print '<p>'
print '<img src="' + imgFile + '">'
print '</body>'
print '</html>'
This completes our first version of the showResults.py CGI script.